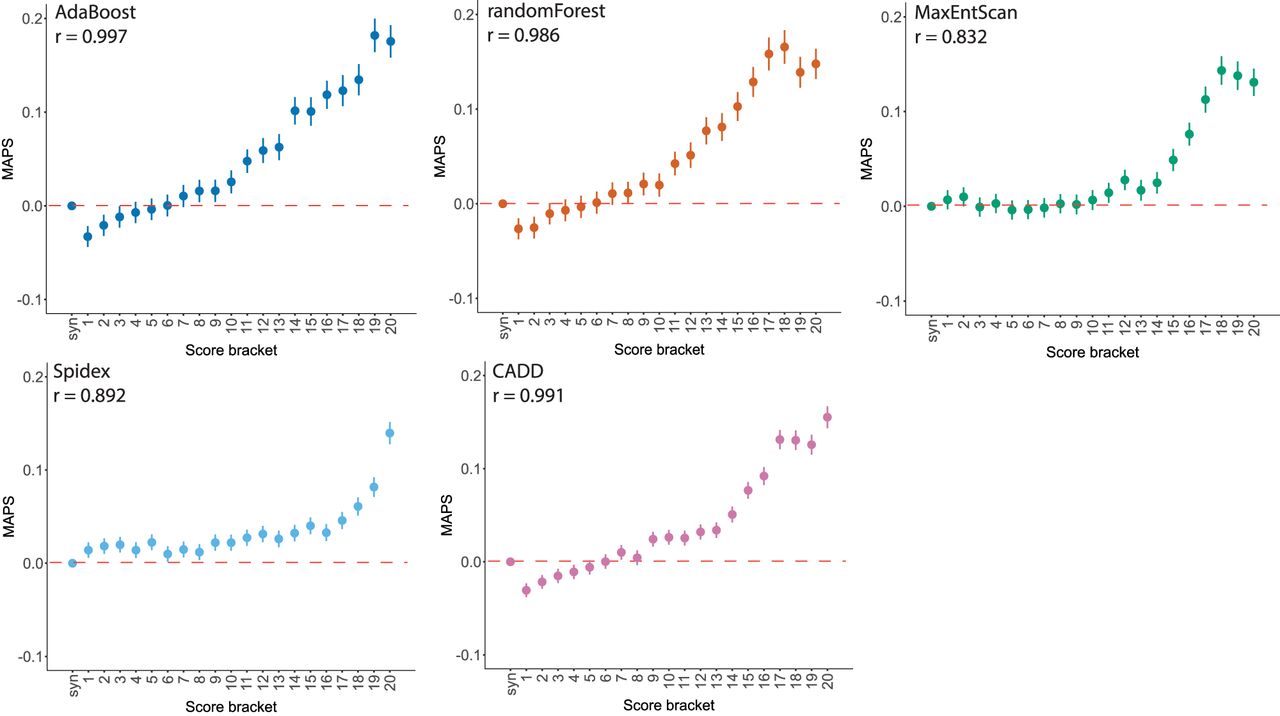
Pathogenicity and selective constraint on variation near splice sites

(Downloading may take up to 30 seconds. If the slide opens in your browser, select File -> Save As to save it.)

Click on image to view larger version.

Figure 4.
Figure 4.

Selective constraint and pathogenicity scores. MAPS, with 95% CI, calculated for pathogenicity score brackets (least to most severe) in 13,750 unaffected parents from the DDD project, with Spearman's rank correlation coefficient.

This Article

  1. Genome Res. 29: 159-170

Preprint Server