
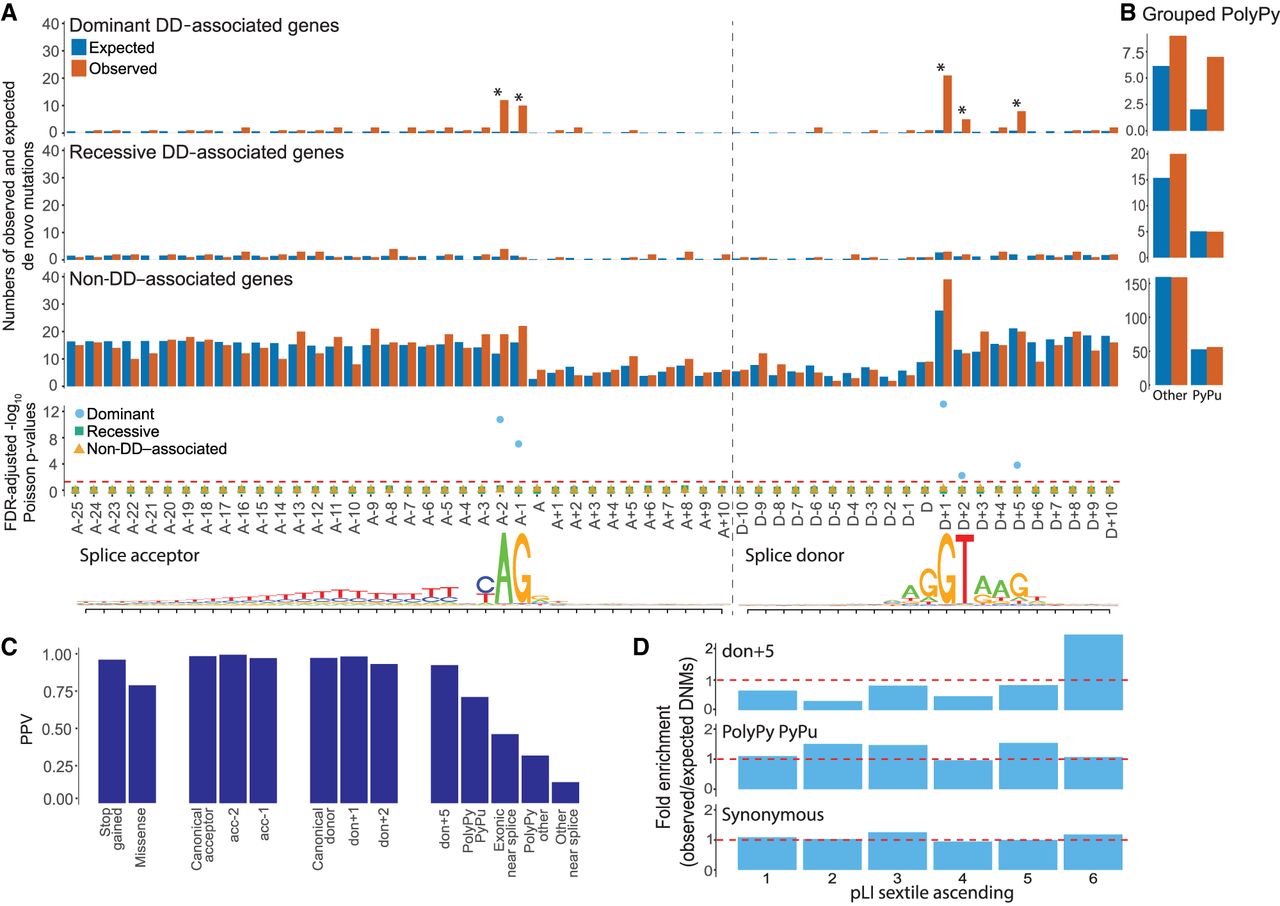
De novo mutations (DNMs) around splice sites. Enrichment of DNMs across the splicing region in 7833 DDD probands. (A) Numbers of observed and expected DNMs across the splicing region in known dominant and recessive DD genes, as well as in non-DD–associated genes, with FDR-corrected Poisson P-values. Splice acceptor and splice donor consensus sequences are shown below, as in Figure 1. (B) Aggregation of observed and expected numbers of DNMs in the PolyPy region, with changes from a pyrimidine to a purine (PyPu) and all other changes shown separately for known dominant and recessive DD genes, as well as non-DD–associated genes. (C) Positive predictive values (PPVs) for DNMs in dominant DD-associated genes in positions across the splicing region, as well as VEP annotated stop gained and missense changes, calculated from observed and expected numbers of DNMs. (D) Enrichment (observed/expected) of DNMs by gene probability of pLI split into sextiles for donor+5, pyrimidine to purine PolyPy, and synonymous sites. pLI scores encompassed by each sextile: 1 = 5.36 × 10−91–0.000000605, 2 = 0.000000609–0.000558185, 3 = 0.000559475–0.027905143, 4 = 0.027908298–0.377456159, 5 = 0.377491926–0.919495985, 6 = 0.91955878–1.


