
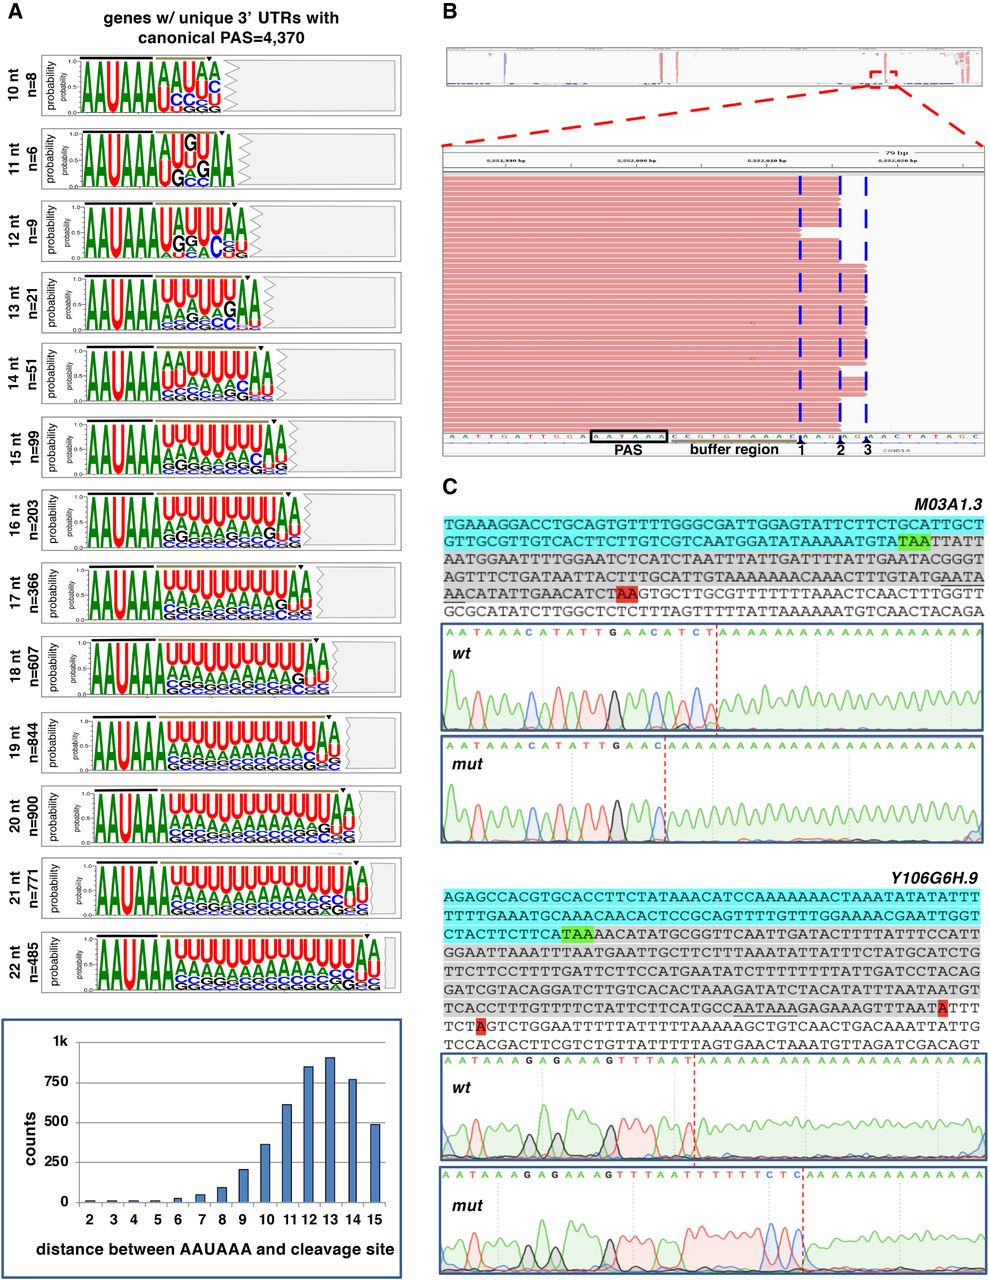
A terminal adenosine nucleotide is required at the cleavage site for correct cleavage. (A) Sequence logos produced from 3′ UTRs of genes only with 3′-UTR isoforms containing the canonical PAS element “AAUAAA” and aligned by their respective buffer region length (n = 4374). Two extra nucleotides are included downstream from each cut site (triangle), highlighting the terminal UA dinucleotide. The nucleotide distribution of the distance between the PAS element and the cleavage site is shown in the bar chart below. (B) Example of slight variability in the cleavage site for the gene C09G9.8. Although prevalent forms are observed, the exact cleavage site varies on several occasions, but it predominantly occurs at a different adenosine nucleotide. (C) Test of the role of the terminal adenosine nucleotide in the cleavage reaction. The 3′-end regions of several test genes were cloned and used to prepare transgenic C. elegans strains expressing this region with or without mutated terminal adenosine nucleotides (red, see below). The top sequence shows the test 3′-end region: (cyan) ORF; (green) translation STOP signal; (gray) 3′ UTR; (red) terminal adenosine nucleotide. The PAS element is underscored. The Sanger trace files show the outcome of the cleavage site location in selected clones. Two genes are shown (M03A1.3 and Y106G6H.9). In the case of M03A1.3, the loss of the terminal adenosine nucleotide sometimes forces the CPC to backtrack and cleave the mRNAs upstream of the regular cleavage site but still at the closest adenosine nucleotide available. In the case of the gene Y106G6H.9, the loss of the terminal adenosine nucleotide forces the complex to skip the cleavage site, which sometimes occurs at the next purine nucleotide. Additional clones and more test genes are shown in Supplemental Figures S11–S13.


