
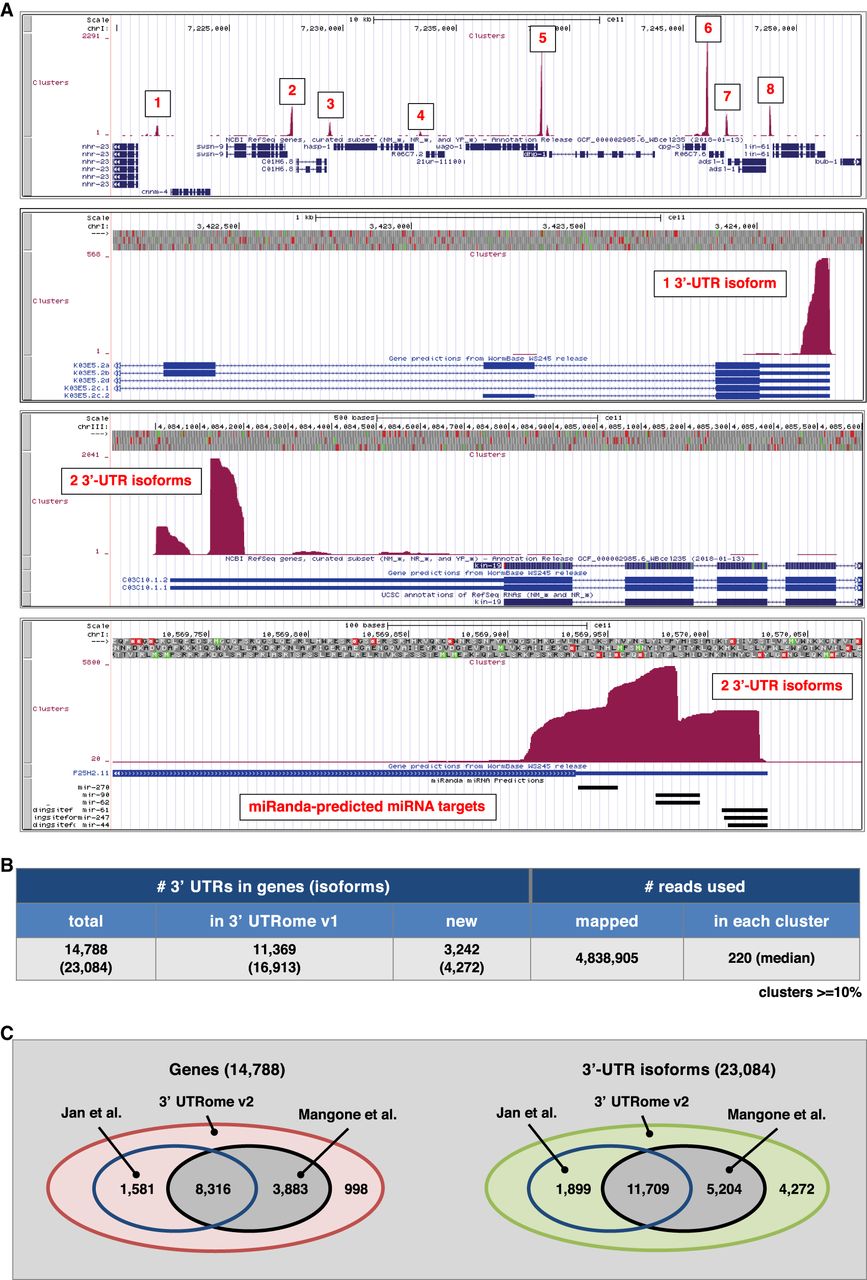
Figure 2.
Cluster preparation and analysis. (A) Screenshots showing several mapped 3′-UTR clusters for genes with one or two 3′-UTR isoforms. MiRanda-predicted miRNA targets are shown for a particular 3′ UTR at the bottom. (B) Summary of the 3′ UTRs in genes identified in this study along with the number of reads mapped and clustered for each 3′ UTR. (C) Comparison between the 3′ UTRs for genes and total isoforms mapped in this study versus the UTRome v1 (Mangone et al. 2010) and the data set from Jan et al. (2011).


