
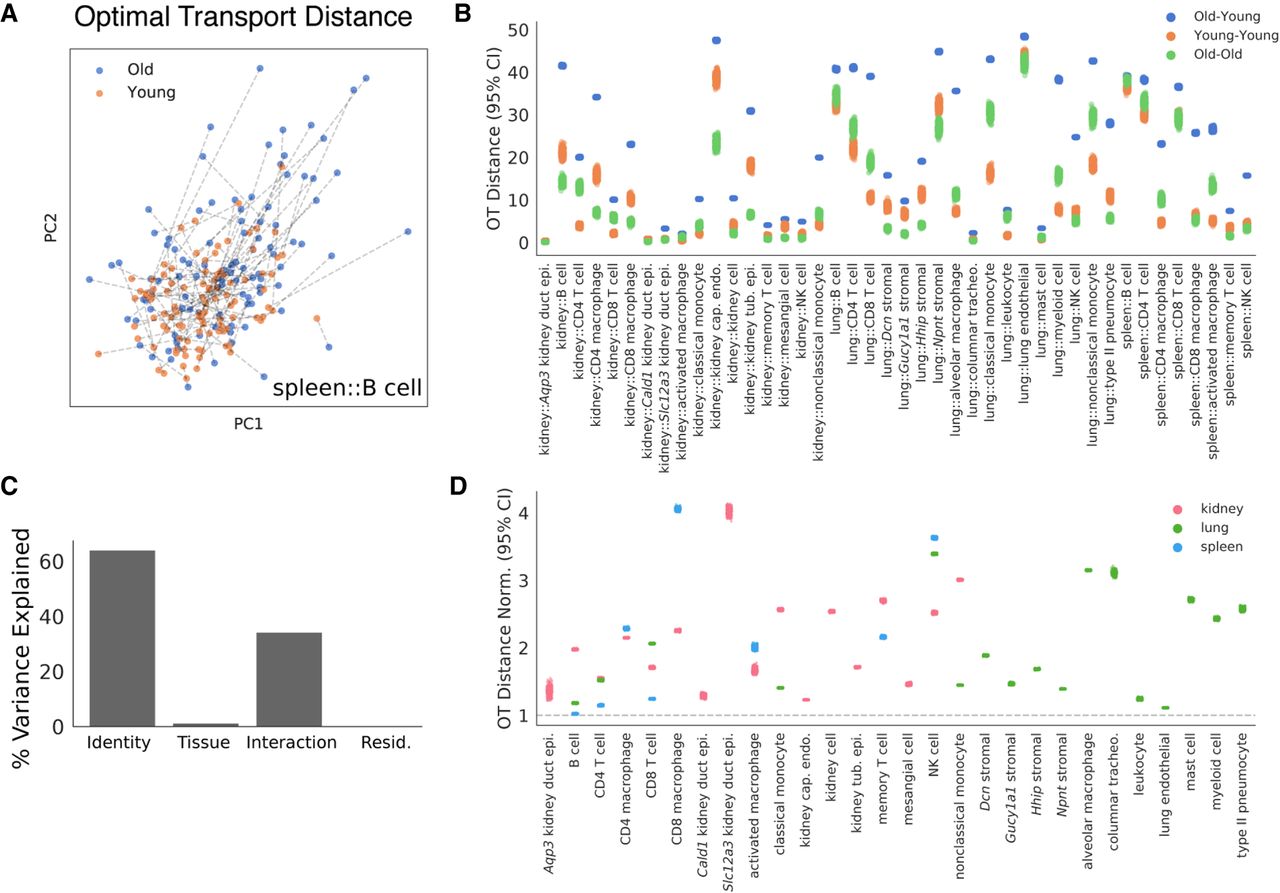
Optimal transport (OT) estimates the magnitude of aging across cell identities. To estimate a magnitude of age-related change in each cell population, we computed an OT distance between random samples of young and old cells from each cell identity in a rank 500 NMF embedding. (A) Young and old spleen B cells are presented in a PCA projection of the NMF embedding. Dashed lines overlaid indicate the globally optimal partners for each young and old cell, collectively representing the OT solution. The sum of distances along each dashed line is the OT distance. OT distances were computed independently for each cell identity across 300 random samples. (B) OT distances for each cell type in each tissue are presented. For each cell identity, we computed distances for heterochronic samples of cells (old-young) and isochronic samples of cells (young-young, old-old). The latter isochronic comparisons serve as negative controls. Distributions across n = 300 random samples each are presented for each of these comparisons. (C) Variance in normalized OT distances explained by cell identity and tissue environment (ANOVA). We fit a linear model with normalized OT distance as the response and cell identity, tissue environment, and their interaction as the inputs. We found that cell identity explains the majority of variation in aging magnitudes, whereas tissue explains little. The residual represents variation across the random samples in which we measured the OT distance. (D) Heterochronic OT distances for each cell identity. Each dot represents the normalized OT distance for a single sample. Values are normalized to the largest mean value of the isochronic negative controls. The gray dotted line marks a normalized distance of 1, which indicates that a heterochronic comparison shows similar distances to an isochronic comparison in that cell identity.


