
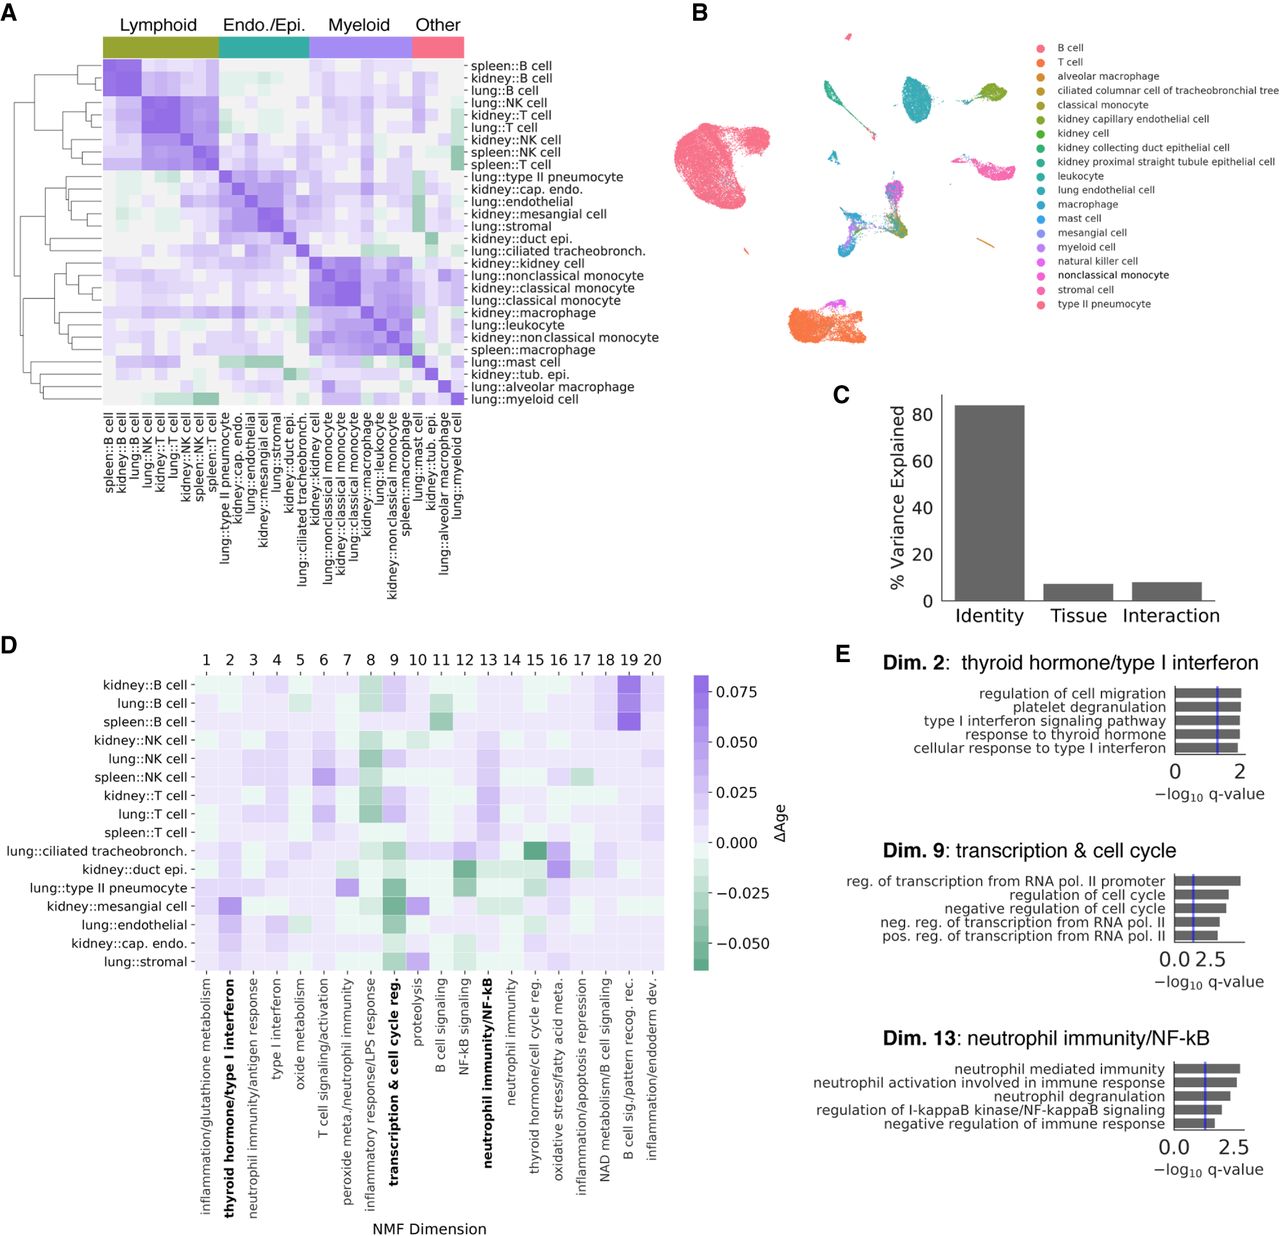
Cell identity and tissue environment influence aging trajectories. We computed aging trajectories as the distance between young and old cell centroids in a non-negative matrix factorization (NMF) low-rank embedding of each cell. We embedded all cells in a common non-negative latent space, where each latent dimension is associated with the activity of particular genes. (A) Cosine similarities between the aging trajectories of each cell state in each tissue are compared in a heatmap. Hierarchical clustering of aging trajectories revealed that similar cell types have similar trajectories. In contrast, different cell types from the same tissue did not cluster together. We labeled clusters based on their constituent cell types above. (B) A UMAP visualization derived from the 20-dimensional NMF embedding with cell types overlaid as colors. The NMF embedding retains biological variation between cell types. (C) Variance in the aging vectors of immune cell types found in all three tissues explained by cell type, tissue environment, and their interaction (ANOVA). (D) Heatmap visualization of the aging vectors for lymphocyte and endothelial/epithelial cell types. Endothelial/epithelial cell types and lymphoid cell types were identified by clustering aging vectors, presented in A. Semantic descriptions of each embedding dimension derived from gene enrichment analysis are presented as column labels. Some expression programs show common changes with age across both groups of cell types, whereas others appear to be different between groups. We highlight three expression programs that show cell-identity-specific changes (bold). (E) Gene Ontology enrichment analysis results for selected dimensions of the NMF embedding.


