
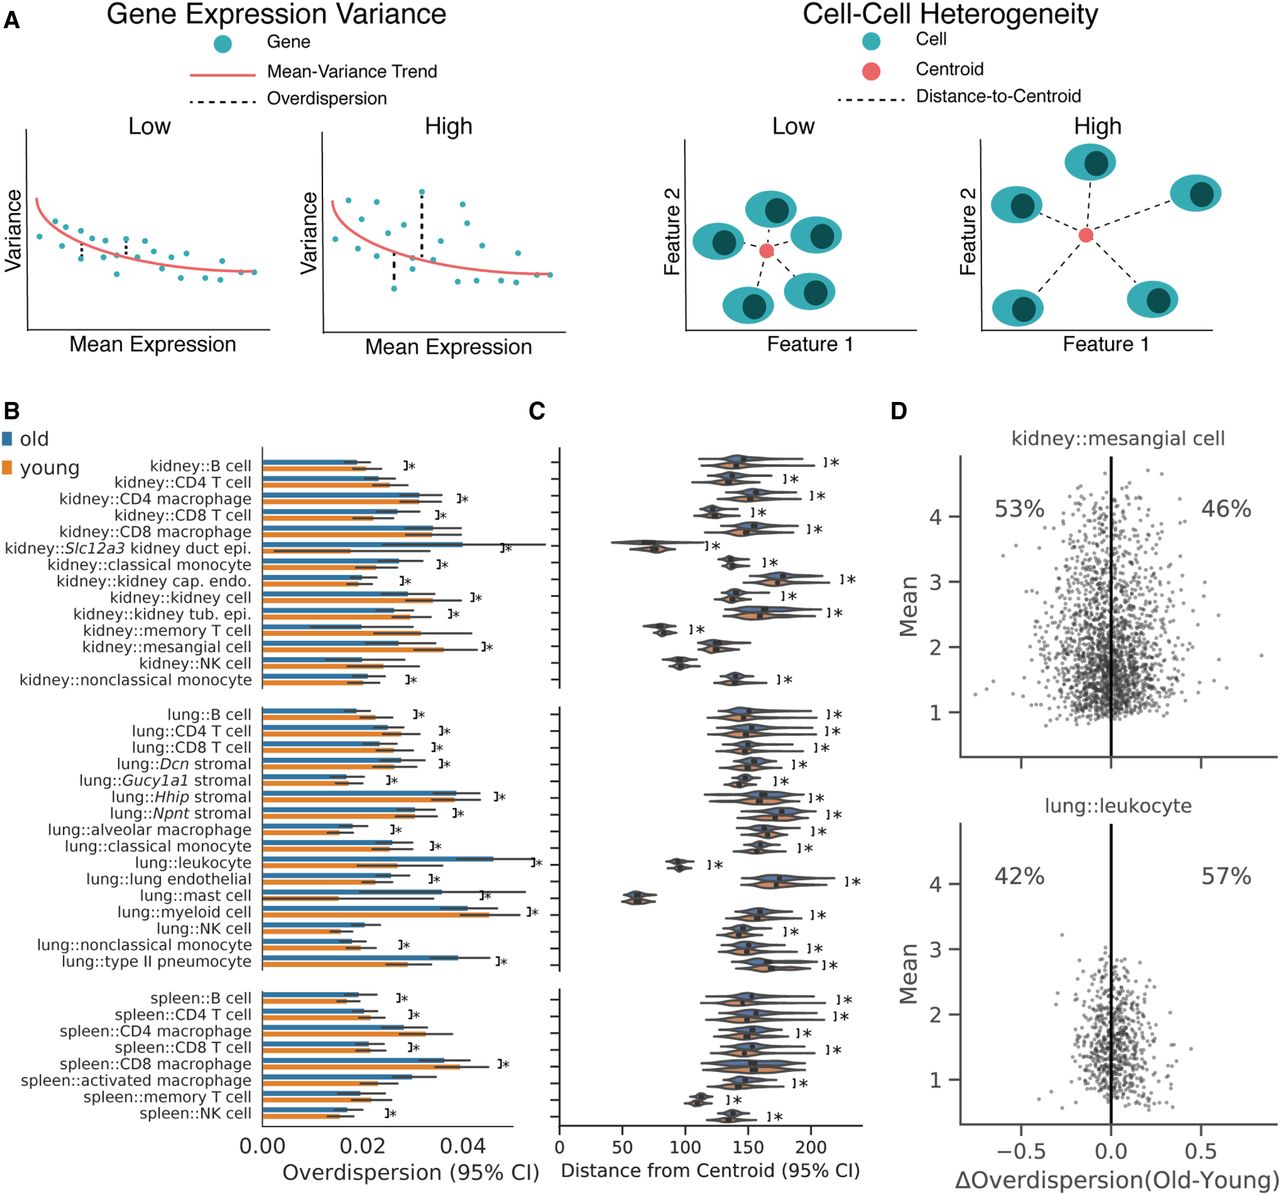
Changes in cell–cell heterogeneity with age depend on cell identity. (A) Diagram illustrating the difference between gene expression variance (left) and cell–cell heterogeneity metrics (right). Gene expression variance measures the variance of the average gene in a manner that controls for mean expression levels. Cell–cell heterogeneity measures the average difference between cells across genes. Examples of data providing high and low values for each metric are schematized. (B) Overdispersion values for each cell identity conditioned on age. We computed overdispersion as the residual dispersion of each gene after accounting for mean expression level with a rolling median dispersion spline (difference from the median method). Each point in the underlying data represents a single gene. Many cell identities do not show a substantial shift in the overdispersion distribution. Some identities show increased mean overdispersion with age, whereas others show a decrease: (*) Wilcoxon rank-sum test, Q < 0.05. (C) Cell–cell heterogeneity measurements based on Euclidean distances to the population centroid for each cell identity and age. We computed Euclidean distances to the centroid for each cell using all measured genes. Each point in the underlying data represents a single cell. Most cell identities showed increased cell–cell heterogeneity in old cells: (*) Wilcoxon rank-sum test, q < 0.05. However, some identities show decreased heterogeneity with age (kidney::CD8 T cell; kidney::classical monocyte). (D) Difference in overdispersion between old and young cells (ΔOverdispersion) as a function of mean gene expression value in VIM-positive kidney capillary endothelial cells (upper) and lung leukocytes (lower). Each point represents the change in overdispersion and mean expression value for a single gene. Shading reflects the density of points. We found that genes within a cell identity show heterogeneous changes in overdispersion with age.


