
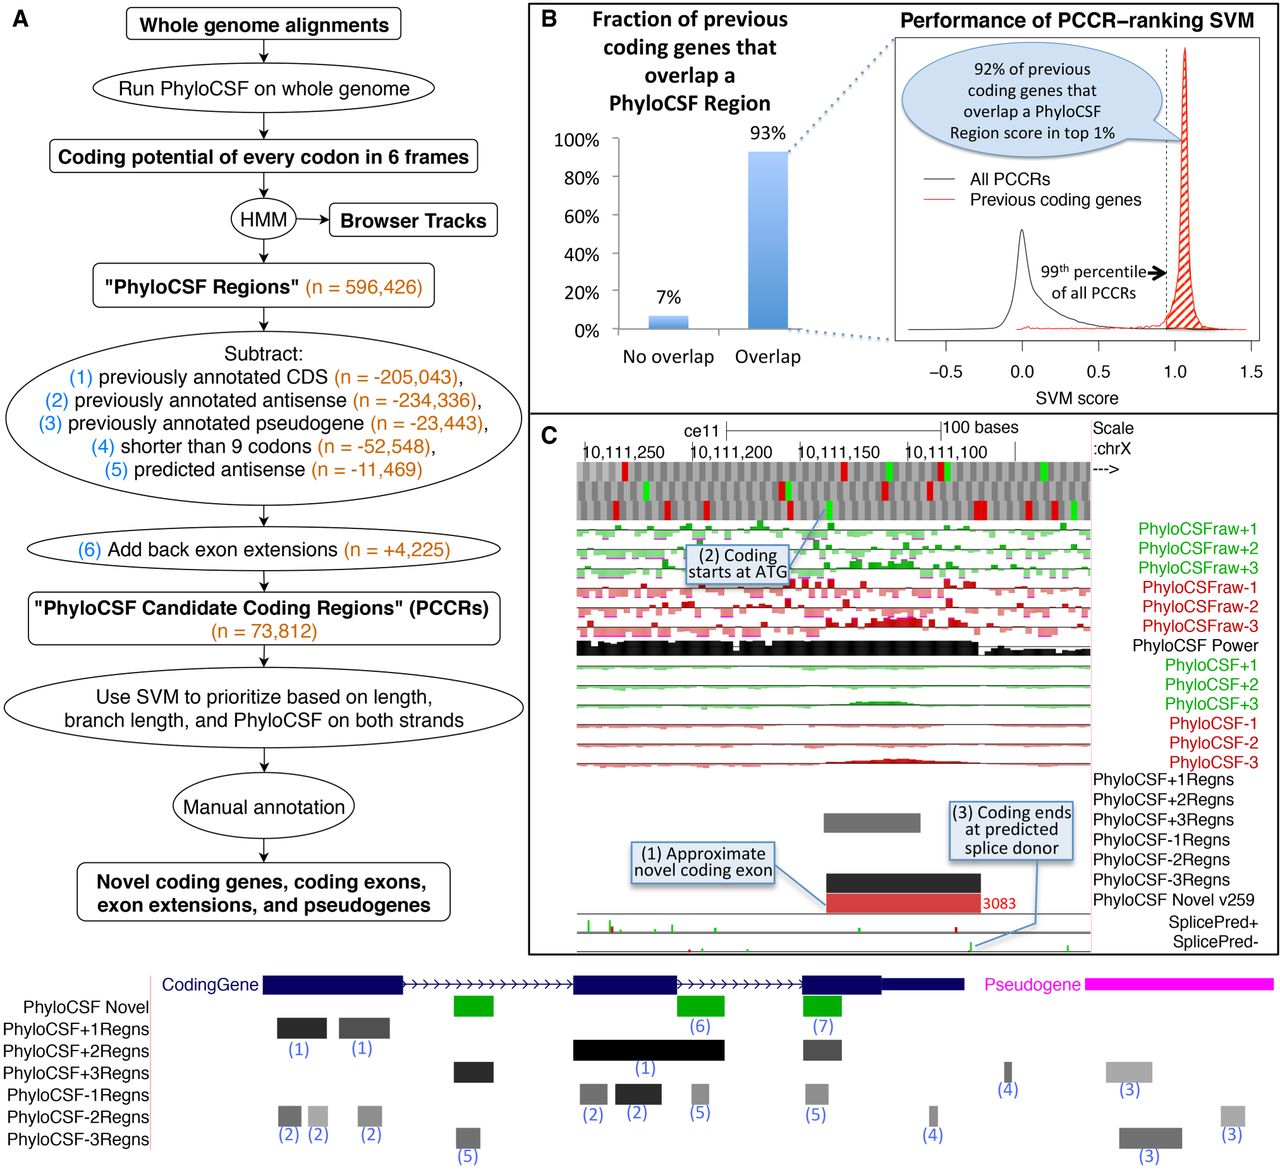
Computing PhyloCSF Candidate Coding Regions (PCCRs). (A) Flow chart of overall process. Numbers in orange are counts for the human hg38 assembly relative to the GENCODE v23 gene set. The hypothetical browser image at the bottom illustrates how the PhyloCSF Regions list is pruned to define PCCRs. In the vicinity of a coding gene (blue) and a pseudogene (pink), we initially have a set of intervals in each of the six possible reading frames (“PhyloCSF Regions”) that are more likely to be in the coding state than noncoding state of the HMM (gray-scale intervals in the six “PhyloCSF*Regns” tracks). We then exclude any that overlap known coding genes in the same frame (1) or anti-sense frame (2) or that overlap known pseudogenes in any frame on either strand (3). Next, we exclude regions less than nine codons long (4) and regions predicted by our antisense SVM to be likely antisense regions (5). Finally, we add back nonoverlapping fragments of PhyloCSF Regions that partly overlap annotations because these could be extensions of known exons (6). The resulting PCCRs are shown in green. These sometimes overlap known coding regions, and this is an indication that the PhyloCSF signal is in a different frame from the annotated one (7). The resulting PCCRs are then ranked by an SVM and investigated by expert manual annotators to find novel coding regions and pseudogenes. (B) Performance on previously annotated coding genes. Column chart on the left shows the fraction (93%) of GENCODE v23 coding genes that overlap at least one PhyloCSF Region; the remaining 7% could not have been identified by our workflow. Density plot on the right measures the efficiency of our PCCR-ranking SVM by showing SVM scores for all PCCRs (black) and scores of the highest-scoring PhyloCSF Region that overlaps each GENCODE v23 coding gene that overlaps at least one PhyloCSF Region (red). For 92% of such coding genes, the score is in the 99th percentile of scores of PCCRs (shaded area), indicating that manual examination of the top-ranked 1% of PCCRs would have uncovered each of these coding genes if it had not been known previously, and suggesting that most true novel coding genes could be identified by examining the best ranking PCCRs. (C) PhyloCSF tracks in UCSC Genome Browser showing the “−” strand of C. elegans Chromosome X. Upper six green and red “PhyloCSFraw” tracks show the raw PhyloCSF score for each codon in each of six reading frames. The black “PhyloCSF power” track indicates the relative branch length of the local alignment, a measure of the statistical power available to PhyloCSF; there is near full alignment for the first approximately three-fourths of the track, but then there are fewer aligned species for the remaining one-fourth. Codons having relative branch length less than 0.1 show no scores. The next six green and red “PhyloCSF” tracks show the PhyloCSF scores smoothed by the HMM. The six “PhyloCSF*Regns” tracks show PhyloCSF Regions, with gray scale indicating the maximum probability of coding. The “PhyloCSF novel” track shows the PCCRs in all six frames combined into a single track with green and red intervals indicating the plus and minus strands, respectively, and with the rank of the region within the list of PCCRs shown next to the region, with lower ranks indicating stronger likelihood of coding. The two “Splice Pred” tracks show splice donor (green) and acceptor (red) predictions at GT and AG dinucleotides, respectively, on the plus and minus strands, with the height of each bar indicating the strength of the splice prediction. In the example shown, the tracks allow us to conjecture that there is a novel coding exon on the minus strand roughly coinciding with the 3083rd PCCR (1), extending from the ATG indicated by the small green rectangle in the third base position track at the top (2) up to the green splice donor prediction in the “SplicePred−” track (3).


