
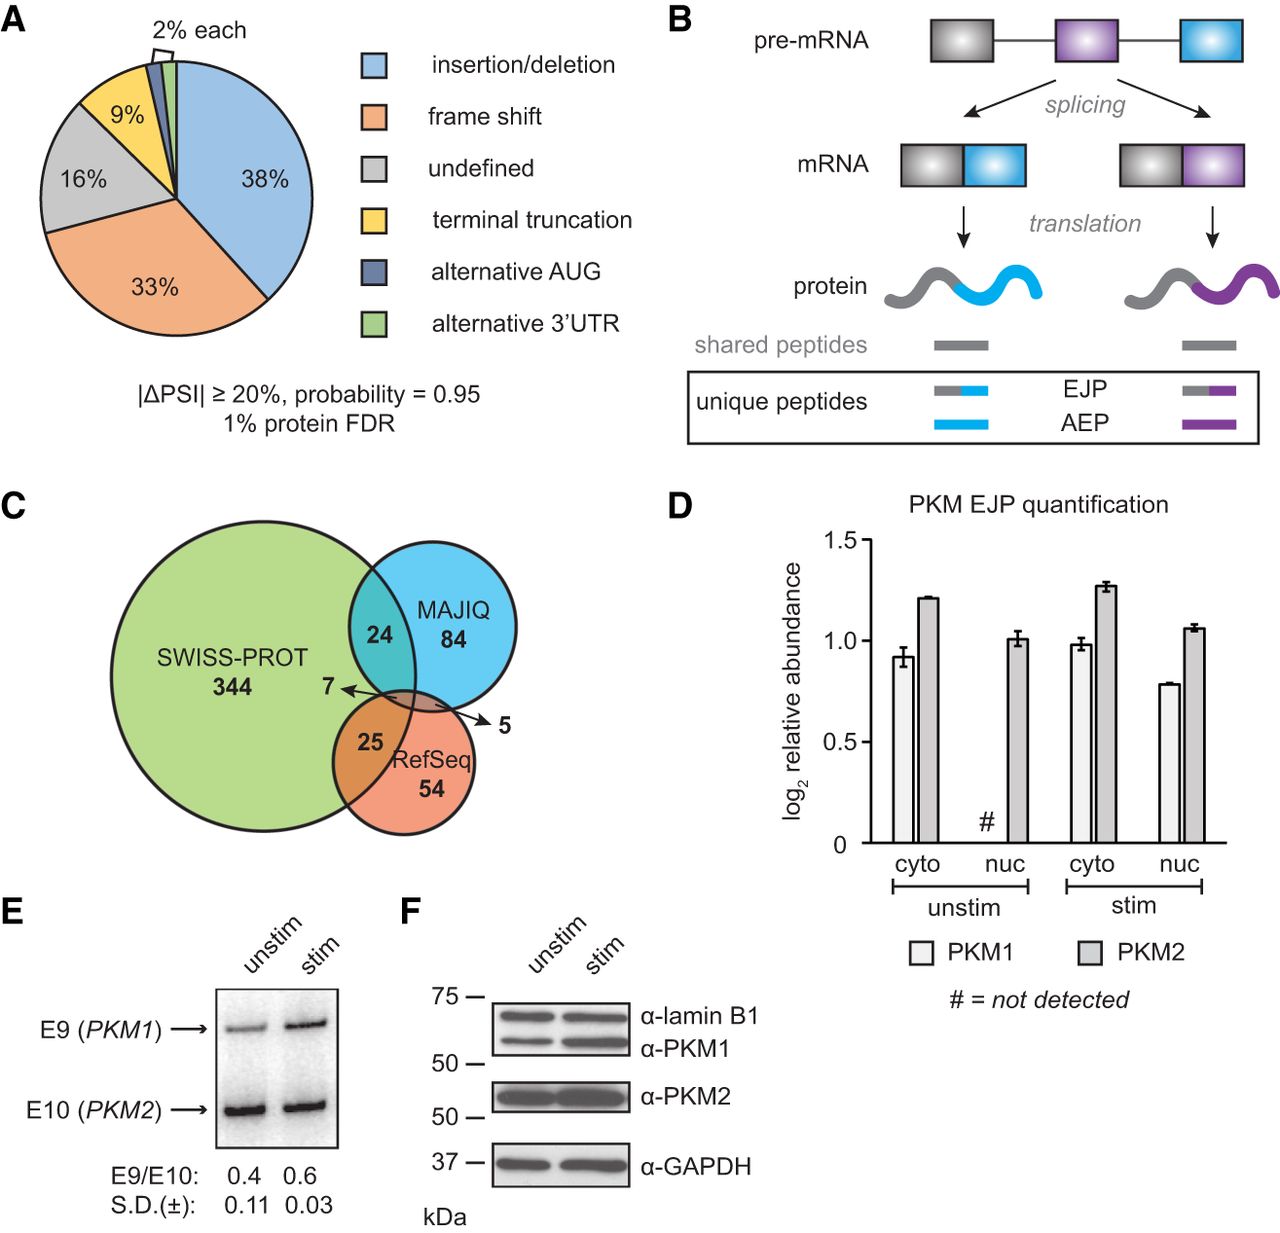
Identification of proteoforms by MS. (A) Pie chart of effect of alternative splicing (AS) events on protein sequence, based on the CDS cassette exons from Figure 1. (B) Schematic representation of AS leading to exon junction peptides (EJPs) and alternative exon peptides (AEPs), which distinguish AS proteoforms. (C) Venn diagram showing the number of peptides that report on alternate proteoforms as identified by SWISS-PROT (canonical + isoforms), our customized MAJIQ junction usage database, and/or RefSeq three-frame translation of transcripts (1% FDR). (D) Quantification of PKM EJP relative abundance by MS-DIA. (E) RT-PCR analysis of PKM-E9 (upper band) and -E10 (lower band) inclusion upon T-cell stimulation. Bands were detected with a Typhoon Phosphorimager and quantified with ImageQuant software (n = 3 per condition). (F) Western blot of PKM1 and PKM2 isoforms in unstimulated and stimulated conditions (5 μg whole-cell extract per lane). Lamin B1 and GAPDH were used as loading controls.


