
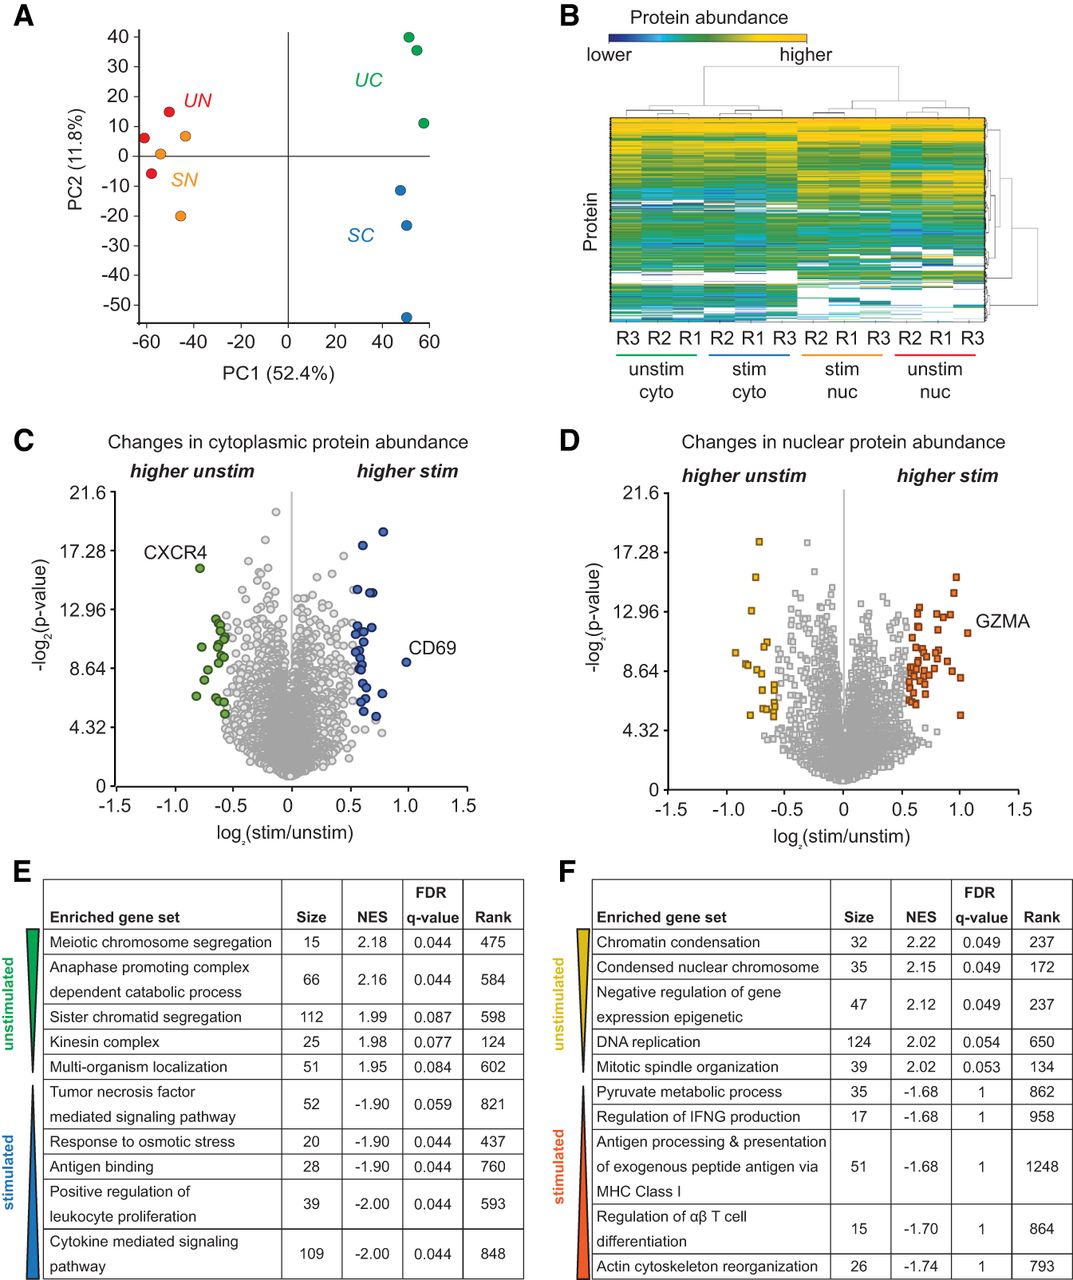
Proteomic analysis of unstimulated and stimulated Jurkat T cells. (A) Principal component analysis (PCA) of three biological replicates (i.e., independent 48-h PMA stimulations and cell fractionations). Data were acquired via MS-DDA and analyzed using Proteome Discoverer 2.2 software (SWISS-PROT database, 1% FDR). (B) Heatmap and clustering of protein abundance as quantified by MS-DIA. Data were analyzed and clustered using Spectronaut software (SWISS-PROT database, 1% FDR). (C,D) Volcano plot of log2 ratio (stimulated/unstimulated) cytoplasmic (C) or nuclear (D) protein abundance (MS-DDA) versus two-tailed t-test adjusted P-value; significance set at 1.5-fold change (>|0.58| when log2 transformed) versus adjusted P-value <0.05 (>4.32 when −log2 transformed), respectively. Negative log2 ratio values represent proteins that are more abundant in unstimulated cells, whereas proteins with positive log2 ratio values are more highly expressed in stimulated cells. Decreased expression of CXCR4 and increased expression of CD69 and GZMA are markers of T-cell activation. (E,F) Top five most significant functional categories by gene set enrichment analysis (GSEA) of proteins significantly changing upon stimulation in the cytoplasm (E) or nucleus (F). Metrics: (1) size, number of genes that are categorized under the GO term; (2) NES, normalized enrichment score for the gene set after it has been normalized across analyzed gene sets; (3) FDR q-value, estimated probability that the normalized enrichment score represents a false positive finding; and (4) rank, position in the ranked list at which the maximum enrichment score occurred (proteins are ranked in order of positive to negative correlation to enrichment [signal/noise] in unstimulated cells).


