
Abstract
The functions of many eukaryotic genes are still poorly understood. Here, we developed and validated a new method, termed GeneBridge, which is based on two linked approaches to impute gene function and bridge genes with biological processes. First, Gene-Module Association Determination (G-MAD) allows the annotation of gene function. Second, Module-Module Association Determination (M-MAD) allows predicting connectivity among modules. We applied the GeneBridge tools to large-scale multispecies expression compendia—1700 data sets with over 300,000 samples from human, mouse, rat, fly, worm, and yeast—collected in this study. G-MAD identifies novel functions of genes—for example, DDT in mitochondrial respiration and WDFY4 in T cell activation—and also suggests novel components for modules, such as for cholesterol biosynthesis. By applying G-MAD on data sets from respective tissues, tissue-specific functions of genes were identified—for instance, the roles of EHHADH in liver and kidney, as well as SLC6A1 in brain and liver. Using M-MAD, we identified a list of module-module associations, such as those between mitochondria and proteasome, mitochondria and histone demethylation, as well as ribosomes and lipid biosynthesis. The GeneBridge tools together with the expression compendia are available as an open resource, which will facilitate the identification of connections linking genes, modules, phenotypes, and diseases.
The identification of gene function and the integrated understanding of their roles in physiology are core aims of many biological and biomedical research projects—an effort that is still far from being complete (Edwards et al. 2011; Pandey et al. 2014; Dolgin 2017; Stoeger et al. 2018). Traditionally, gene function has been elucidated through experimental approaches, including the evaluation of the phenotypic consequences of gain- or loss-of-function (G/LOF) mutations (Austin et al. 2004; Dickinson et al. 2016), or by genetic linkage or association studies (Williams and Auwerx 2015). A large number of bioinformatics tools have been developed to predict gene function based on sequence homology (Marcotte et al. 1999; Radivojac et al. 2013; Jiang et al. 2016), protein structure (Roy et al. 2010; Radivojac et al. 2013; Jiang et al. 2016), phylogenetic profiles (Pellegrini et al. 1999; Tabach et al. 2013; Li et al. 2014), protein-protein interactions (Rolland et al. 2014; Hein et al. 2015; Huttlin et al. 2017), genetic interactions (Tong et al. 2004; Costanzo et al. 2010; Horlbeck et al. 2018), and coexpression (Langfelder and Horvath 2008; Warde-Farley et al. 2010; Greene et al. 2015; van Dam et al. 2015; Szklarczyk et al. 2016; Li et al. 2017; Obayashi et al. 2019).
With the development of transcriptome profiling technologies, thousands of high-throughput studies have generated a wealth of genome-wide data that has become a valuable resource for systems genetics analyses. A few web resources, including NCBI Gene Expression Omnibus (GEO) (Barrett et al. 2013), ArrayExpress (Kolesnikov et al. 2015), GeneNetwork (Chesler et al. 2004), and Bgee (Bastian et al. 2008) among others, have created repositories of such expression data for curation, reuse, and integration. Several tools, such as GeneMANIA (Warde-Farley et al. 2010), GIANT (Greene et al. 2015), SEEK (Zhu et al. 2015), GeneFriends (van Dam et al. 2015), WeGET (Szklarczyk et al. 2016), COXPRESdb (Obayashi et al. 2019), WGCNA (Langfelder and Horvath 2008), and CLIC (Li et al. 2017), are able to assign putative new functions to genes by means of correlations or coexpression networks. At their core, these methods rely on the concept of guilt-by-association—that transcripts or proteins exhibiting similar expression patterns tend to be functionally related (Eisen et al. 1998). By using overrepresentation analyses on subnetworks or modules, one can then deduce aspects of gene functions.
However, these approaches generally depend on discrete subsets of genes whose expression correlations exceed either a hard or soft threshold, which would strongly influence the final results. In addition, such analyses typically focus on positive or absolute values of correlations among data sets. The key polarity of interactions is often lost among gene products and linked modules (Warde-Farley et al. 2010; Greene et al. 2015; van Dam et al. 2015; Zhu et al. 2015; Li et al. 2017). Gene set analyses, such as gene set enrichment analysis (GSEA) (Subramanian et al. 2005), have been developed to identify processes or modules that are affected by certain genetic or environmental perturbations (Khatri et al. 2012). While GSEA uses all measured genes in the analysis, its application has mainly been limited to studying G/LOF models or environmental perturbations, where comparisons are inherently among discrete categories. This limits its applicability in most populations, in which variations among individuals are often subtle and continuous (Williams and Auwerx 2015).
Here, we developed the GeneBridge toolkit that uses two interconnected approaches to improve upon the identification of gene function and to bridge genes to phenotypes using large-scale cross-species transcriptome compendia collected for this study. First, we describe a computational approach, named Gene-Module Association Determination (G-MAD), to impute gene function. G-MAD considers expression as a continuous variable and identifies the associations between genes and modules. Second, we developed the Module-Module Association Determination (M-MAD) method to identify connections between modules based on the transcriptome compendia. The data and GeneBridge tools described here are available at systems-genetics.org, an open resource, which will facilitate the identification of novel connections between genes, modules, phenotypes, and diseases.
Results
Gene-Module Association Determination (G-MAD)
Owing to the fact that a large number of genes are still not well annotated or even uncharacterized (Supplemental Fig. S1), we propose here a new computational strategy, Gene-Module Association Determination (G-MAD), which uses expression data from large-scale cohorts to propose potential functions of genes. We use the term “modules” to refer to the knowledge-based gene sets, ontology terms, and biological pathways from different resources for simplicity in the rest of the paper. The differences between gene sets or directed or undirected pathways are important in many contexts, but for our purpose, they can be treated in the same manner as modules and will not be distinguished. The basic concept is similar to classic pathway/gene set analysis, i.e., genes that possess similar functions tend to have similar expression patterns (Subramanian et al. 2005). However, instead of using binary group settings (e.g., control vs. treatment, or wild type vs. knockout) as commonly used in gene set analysis, we consider the continuous expression levels of the gene-of-interest across a population and determine its possible functions based on its coexpression patterns against all genes.
In this study, we collected transcriptome data sets with over 80 samples obtained from six species (human, mouse, rat, fly, worm, and yeast) from GEO, ArrayExpress, dbGaP, GeneNetwork, and other data repository sources (Supplemental Table S1). For example, 1337 data sets containing over 265,000 human samples with whole-genome transcript levels were analyzed in this study (Supplemental Table S1). The expression data sets were preprocessed using PEER (Stegle et al. 2012) to remove the known and hidden covariates that would influence the analysis (Supplemental Fig. S2). We applied a competitive gene set testing method—Correlation Adjusted MEan RAnk gene set test (CAMERA), which adjusts for inter-gene correlations (Wu and Smyth 2012)—to compute the enrichment between gene-of-interest and biological modules. Gene-module connections with enrichment P-values that survived multiple testing corrections of the gene or module numbers were allocated connection scores of 1 or −1, based on the enrichment direction, and 0 otherwise. The results were then meta-analyzed across data sets, and gene-module association scores (GMASs) were computed as the averages of the connection scores weighted by the sample sizes and inter-gene correlation coefficients within modules (Fig. 1A).
Gene-Module Association Determination (G-MAD). (A) G-MAD methodology. See text and Methods for detailed description. (B) Module similarity network showing the composition similarities across all module pairs. Modules were detected using a community detection algorithm embedded in Gephi and indicated in different colors. The 10 most frequent words of the module terms in each module were used to represent the module and can be found in Supplemental Table S2. (C) Influence of the GMAS threshold (t) on the true positive rate (TPR) and false positive rate (FPR) of G-MAD. Using a threshold of 0.268, G-MAD identified 10% of true positives and 0.24% of false positives (reflected by the red lines intersecting the x- and y-axes). (D) G-MAD revealed the potential role of WDFY4 in T cell activation and immune response. The threshold of significant gene-module association is indicated by the red dashed line. Modules are organized by the module similarities. Known modules connected to WDFY4 from annotations are shown in red dots (there is no known connected module for WDFY4) and other modules with GMAS over the threshold are shown in black dots. Dot sizes reflect the GMAS of WDFY4 against the respective modules. Detailed information of all the modules is available at www.systems-genetics.org/modules_by_gene/WDFY4?organism=human. (E) G-MAD identified the involvement of known as well as 20 novel genes in cholesterol biosynthesis. The threshold of significant gene-module association is indicated by the red dashed line. Genes are organized by the genetic positions across chromosomes. Genes annotated to be involved in cholesterol biosynthesis are shown in red dots and novel genes with GMAS over the threshold are shown in black dots. Novel genes conserved in human, mouse, and rat are highlighted in red bold text.
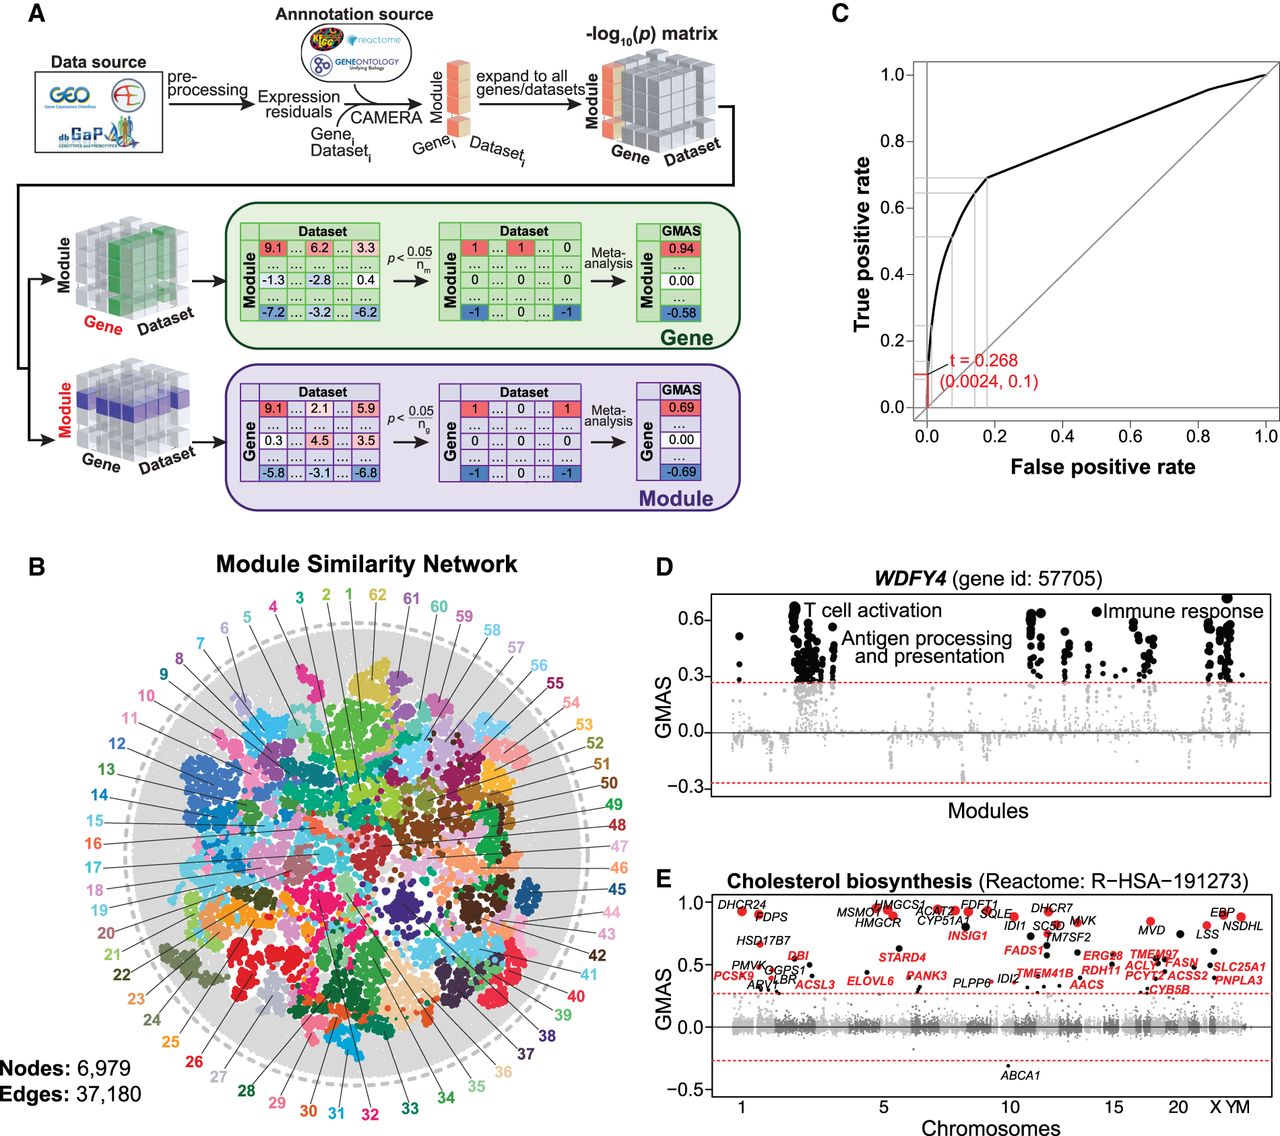
One should be aware of the fact that modules can overlap partially or completely. For example, Gene Ontology (GO) categories have a hierarchical structure (Ashburner et al. 2000), and modules from different sources can be very similar in composition. Therefore, we computed the similarities across all modules and generated a global module similarity network. As expected, redundant modules formed clusters in the network, and we were able to extract 62 distinct module clusters in the human module similarity network (Fig. 1B; Supplemental Table S2). This network can be used as a way to visualize the results of gene-module associations.
We assessed the performance of G-MAD in prioritizing known genes for modules through cross-validation. We then compared the area under the receiver operating characteristic (ROC) curve (AUC) with the ones obtained from WeGET (Szklarczyk et al. 2016) and COXPRESdb (Obayashi et al. 2019). G-MAD exhibits better predictive performance than WeGET and COXPRESdb, especially for larger modules (e.g., those with more than 50 genes), as well as a much simpler method based on the average of correlation coefficient between gene pairs using the same expression compendium of our method (average r) (Supplemental Fig. S3A,B). To estimate if the performance gained from larger data set numbers in our study, we repeated G-MAD using a subset (800) of the data sets (G-MADsub). We observed that G-MADsub had similar performance as G-MAD and better than COXPRESdb and WeGET, where around 1000 data sets were used. We investigated the influence of the inter-gene correlations within modules and module size on the predictive performance of G-MAD and noticed that modules with higher inter-gene correlations and smaller modules tend to have better performances (Supplemental Fig. S3C,D).
Furthermore, in order to determine the threshold of significance of gene-module associations, we computed the GMAS of all the gene-module pairs, including both known and unknown pairs. We then created the ROC curve by varying the threshold of significance and calculating the true positive rate (percentage of known genes above the threshold against all known genes) and false positive rate (percentage of unknown genes above the threshold against all unknown genes) (Fig. 1C). Detecting more true positives by lowering the threshold comes with a cost of a higher false positive rate. Therefore, to be stringent in proposing novel gene-module associations and restrain the likelihood of raising false positives, we considered a true positive rate of 0.1 (only 10% of all the known gene-module pairs as significant), and used a GMAS threshold of 0.268 (Fig. 1C). With this threshold, we saw that only 0.24% of unknown gene-module pairs are significant, which is 40 times less than the known pairs.
The gene-module connections predicted by G-MAD provide a resource that researchers can use as a reference when annotating gene functions. We describe below some examples on how the G-MAD results can be used to facilitate the discovery of novel gene functions or the identification of new members of modules. WDFY4 was recently annotated as a crucial gene in activating immunological T cells in antiviral and antitumor immunity through a functional CRISPR screen (Theisen et al. 2018). Through G-MAD, we found that WDFY4 indeed associated with antigen processing, T cell activation, and immune response in human, mouse, and rat (Fig. 1D; Supplemental Fig. S4A,B), verifying that its function is conserved across species. Cholesterol is critical in cell differentiation and growth. We identified 20 genes (AACS, ACLY, ACSL3, ACSS2, CYB5B, DBI, ELOVL6, ERG28, FADS1, FASN, INSIG1, PANK3, PCSK9, PCYT2, PNPLA3, RDH11, SLC25A1, STARD4, TMEM41B, TMEM97) associated with cholesterol biosynthesis conserved in human, mouse, and rat (Fig. 1E; Supplemental Fig. S4C–E). Several of these genes, including FASN (Carroll et al. 2018) and TMEM97 (Bartz et al. 2009), have already been described to have relevant functions in cholesterol metabolism.
G-MAD identifies tissue-specific associations
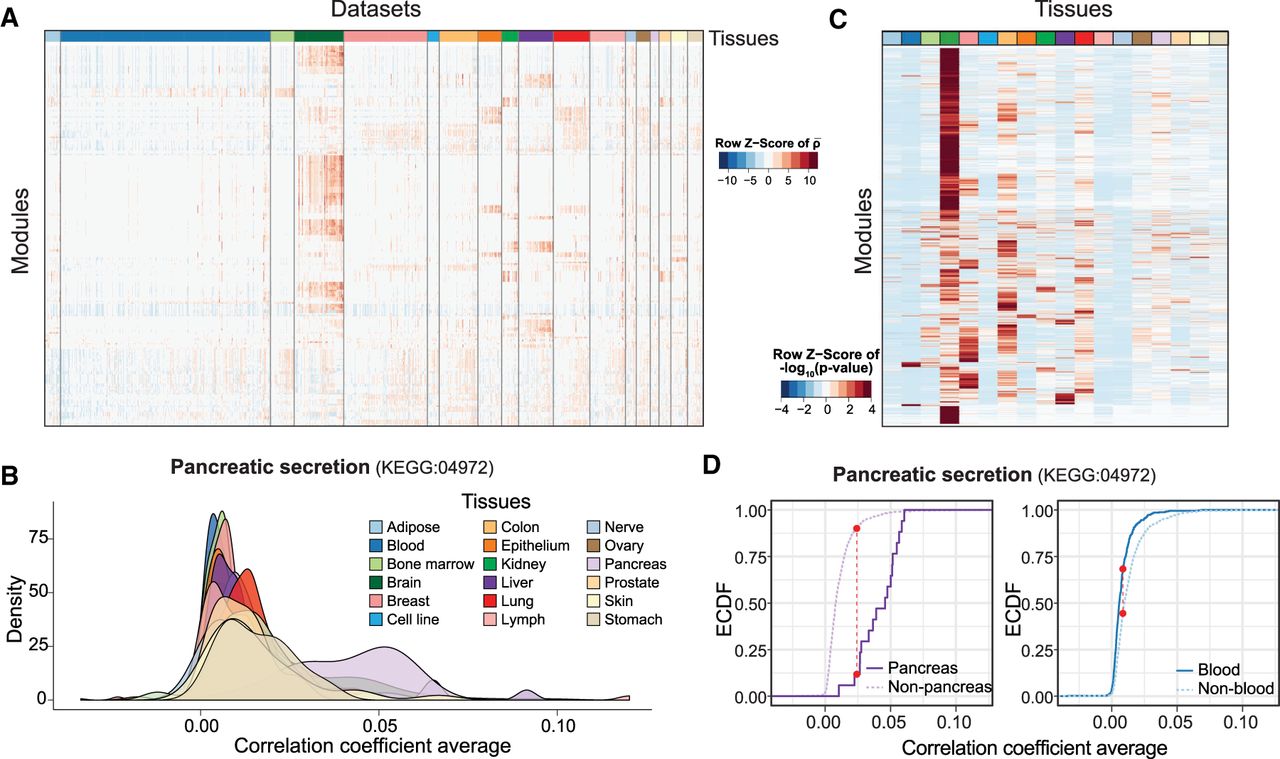
Using the expression compendia, we noticed that genes annotated to some modules have higher coexpression in data sets from certain tissues than others (Fig. 2A), suggesting the tissue-specific activation of these modules. For instance, genes involved in “pancreatic secretion” have much higher coexpressions in data sets obtained from pancreas (Fig. 2B). To predict the tissue specificity of modules, we compared the inter-gene correlations within each module in every tissue against those in the other tissues using the nonparametric Kolmogorov–Smirnov (K–S) test. The resulting P-values are used as a measure to indicate tissue specificity of the modules (Fig. 2C). As an example, the “pancreatic secretion” module has higher specificity in the pancreas than in other tissues, such as the blood (Fig. 2D). Similarly, genes belonging to the “collecting duct acid secretion” module are highly coexpressed in kidney (Supplemental Fig. S5A–E), while genes in the “lamellar body” module are highly coexpressed in lung (Supplemental Fig. S5F–J).
Predicting tissue specificity of modules. (A) Heat map showing the correlation coefficient averages of genes in modules from expression data of a subset of human data sets. Data sets from different tissues are arranged and colored (top bar). Modules are clustered in rows using hierarchical clustering. values for each module are centered and scaled. (B) Coexpressions among genes of pancreatic secretion module across tissues in human. The average correlation coefficients across the genes in the pancreatic secretion module in human data sets are used to illustrate the coexpressions of this module across tissues. Genes in the pancreatic secretion module have higher coexpression in data sets from the pancreas compared to those from other tissues. (C) Heat map showing the tissue specificity of modules inferred from the correlation coefficient of respective tissues against the other tissues. Modules are clustered in rows using hierarchical clustering. The −log10(P-values) obtained from the K–S test are centered and scaled for each module. (D) The tissue-specificity of pancreatic secretion in pancreas (left) and blood (right) is illustrated by the empirical cumulative distribution function (ECDF). The red dotted lines indicate the K–S statistic, which is based on the maximum distance between the two curves. Curves shifting toward the right indicate that data sets from the respective tissue have a higher correlation coefficient and, therefore, greater specificity for this tissue. In this case, the steeply rising part of the ECDF, also shown as the peak of the density of the correlations in B, is shifted toward higher correlations.
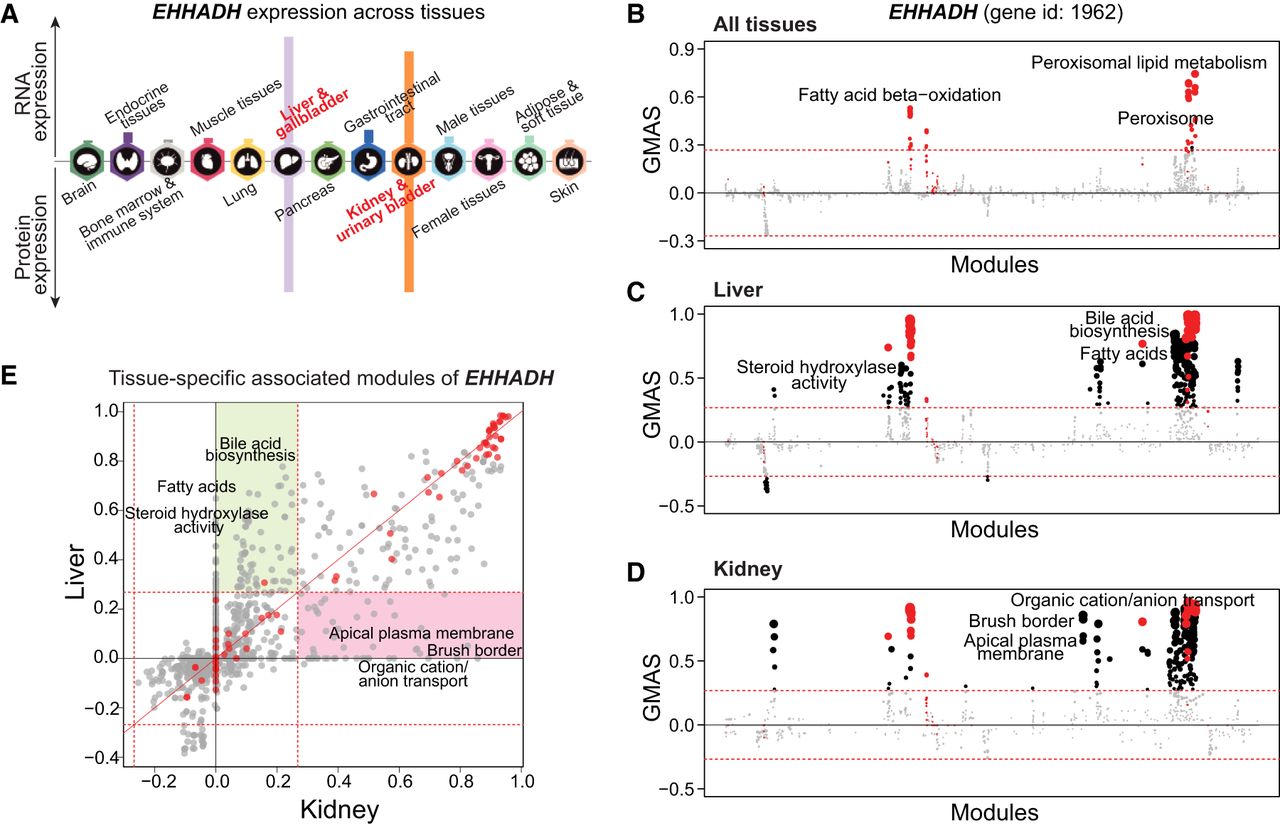
Therefore, G-MAD can also highlight tissue-specific gene-module associations using data sets from specific tissues. EHHADH is a peroxisomal protein highly expressed in liver and kidney (Fig. 3A; Uhlen et al. 2015). Although best known for its key role in the peroxisomal oxidation pathway, a recent report demonstrated that EHHADH mutations cause renal Fanconi's syndrome (Klootwijk et al. 2014). G-MAD of EHHADH in liver and kidney identifies its conserved role in peroxisome and fatty acid oxidation and also recovers its specific functions in liver (e.g., bile acid biosynthesis) and kidney (e.g., brush border membrane) (Fig. 3B–E; Supplemental Table S3). SLC6A1 is one of the major gamma-aminobutyric acid (GABA) transporters in the neurotransmitter release cycle in brain (Carvill et al. 2015). However, SLC6A1 is also highly expressed in the liver (Supplemental Fig. S6A), and its function in liver remains poorly understood. G-MAD of SLC6A1 was performed in all data sets and only data sets from brain confirm its function as a neurotransmitter transporter in the GABA release cycle (Supplemental Fig. S6B,C), while G-MAD using data sets from liver identifies its possible role in carboxylic acid transport and metabolism (Supplemental Fig. S6D,E; Supplemental Table S4).
G-MAD identifies tissue-specific associated modules for EHHADH by using data sets from different tissues. (A) Expression patterns of EHHADH across tissues. The figure was adapted from the Human Protein Atlas (www.proteinatlas.org/). (B–D) G-MAD of EHHADH in human using data sets from all tissues (B), from liver (C), or from kidney (D). The threshold of significant gene-module association is indicated by the red dashed line. Modules are organized by their similarities. Known modules connected to EHHADH from gene annotations are shown in red dots and other modules with GMAS over the threshold are shown by black dots. (E) Comparison of G-MAD results of EHHADH in liver and kidney. Known modules connected to EHHADH are shown in red dots. The threshold of significant gene-module association is indicated by the red dashed line. Modules significantly associated with EHHADH only in one specific tissue are highlighted. The comparison of the association results of EHHADH in liver and kidney can be found in Supplemental Table S3.
G-MAD determines novel genes linked to mitochondria
Mitochondria are the main powerhouses of cells and harvest energy in the form of ATP through mitochondrial respiration. There are around 1100 genes known to encode mitochondria-localized proteins (mito-proteins), depending on the source used (e.g., 1158 mito-proteins in MitoCarta [Calvo et al. 2016], 1074 in Human Protein Atlas [Uhlen et al. 2015]); however, many of these genes remain uncharacterized, and the list of mito-proteins is still incomplete (Williams et al. 2018).
By using the genes annotated to be involved in the respiratory electron transport chain (ETC, Reactome: R-HSA-611105), we searched for genes potentially related to respiratory electron transport, by applying G-MAD to expression data sets in human, mouse, and rat. As expected, genes annotated in the ETC module are strongly enriched; moreover, other known ETC genes that were not included in the module were also positively enriched, providing proof that G-MAD can recover known gene functions (Fig. 4A; Supplemental Fig. S7A,B). Based on G-MAD results from human, mouse, and rat, there were 707 genes showing conserved associations with the ETC (Fig. 4B). Many of these genes—for example, DMAC1 (previously known as C9orf123) (Arroyo et al. 2016; Stroud et al. 2016; Horlbeck et al. 2018), NDUFAF8 (previously known as C17orf89) (Floyd et al. 2016), and FMC1 (previously known as C7orf55) (Lefebvre-Legendre et al. 2001; Li et al. 2017)—were not included in the respiratory electron transport module but have been recently validated to be involved in mitochondrial respiration (Fig. 4B; Supplemental Table S5). DDT is among the top genes associated with the ETC (Fig. 4A,B), and there is no previous study linking it to mitochondria. G-MAD reveals that DDT is strongly associated with mitochondrial respiration across different species, including the invertebrate Caenorhabditis elegans (Fig. 4C,D; Supplemental Fig. S7C–G), suggesting a conserved role of DDT in mitochondria. We validated the mitochondrial localization of DDT through immunofluorescence staining (Fig. 4E). The function of DDT was confirmed through RNAi-mediated knockdown in HEK293 cells, which led to reduced transcript levels of genes encoding for the ETC subunits (Supplemental Fig. S7H; Supplemental Table S6) and decreased oxygen consumption rate (OCR) (Fig. 4F; Supplemental Fig. 7I), verifying that DDT impacts mitochondrial respiration. Similarly, we also validated the involvement of BOLA3 in the ETC using G-MAD and further experimental validations (Supplemental Fig. S8; Cameron et al. 2011).
G-MAD predicts novel genes linked to mitochondria. (A) G-MAD Manhattan plot of the respiratory electron transport (Reactome: R-HSA-611105) module in human. Genes are arranged based on their genetic positions and genes annotated to be involved in the module are colored red. Genes with absolute GMAS over 0.268 are considered significantly associated. DDT, BOLA3, and ARID1A are labeled. (B) Venn diagram of novel genes associated with respiratory electron transport module in human, mouse, and rat; 707 genes were predicted to be mito-proteins by G-MAD in all three species, and 351 genes, including DMAC1, NDUFAF8, FMC1, and BOLA3, were recently annotated to be involved in mitochondrial respiration in at least one species, whereas 356 genes, including DDT, C16orf91, C15orf61, FLAD1, and GRHPR, have not been previously linked with mitochondria based on the current annotations. The association results for all genes in human, mouse, and rat can be found in Supplemental Table S5. (C) DDT associates with mitochondrial respiratory chain modules in human. The threshold of significant gene-module association is indicated by the red dashed line. Modules are organized by module similarities. Known modules connected to DDT from annotations are highlighted in red and other modules with GMAS over the threshold are colored in black. Dot sizes reflect the GMAS of DDT against the respective modules. (D) Module similarity network showing the modules associated with DDT. Modules are plotted based on their layout in Figure 1B and colored based on their GMAS against DDT. (E) Mitochondrial localization of DDT in mouse embryonic fibroblasts (MEFs). DDT expression is overlapped with the Mitotracker red label. (F) DDT knockdown leads to the reduction of oxygen consumption rate (OCR) as a reflection of mitochondrial respiration in human HEK293 cells. Addition of specific mitochondrial inhibitors, including the oligomycin (ATPase inhibitor), FCCP (uncoupling agent), and rotenone/antimycin A (electron transport chain inhibitors), are indicated by arrows. (G) ARID1A negatively associates with the mitochondrial respiratory chain in human. The threshold of significant gene-module association is indicated by the red dashed line. Modules are organized by the module similarities. Known modules connected to ARID1A from extant annotations are highlighted in red and other modules with GMAS over the threshold are colored in black. Dot sizes are proportional to GMAS of the respective modules. (H) Module similarity network showing the modules associated with ARID1A. Modules are colored based on their GMAS against ARID1A. (I) Mice with the uterine-specific Arid1a knockout showed positive enrichment in mitochondrial respiration modules. Nominal P-values from the GSEA results are used to plot against normalized enrichment score (NESs), with dot sizes indicating the number of genes in the modules and transparencies indicating the false discovery rate (FDR). (J) Enrichment plot showing the enrichment of genes included in respiratory electron transport in uterus-specific Arid1a knockout mice compared to wild-type controls. Genes are ranked based on the fold change between Arid1a knockout and wild-type mice, and the ranking positions of genes in respiratory electron transport are labeled as vertical black bars. (NES) Normalized enrichment score.
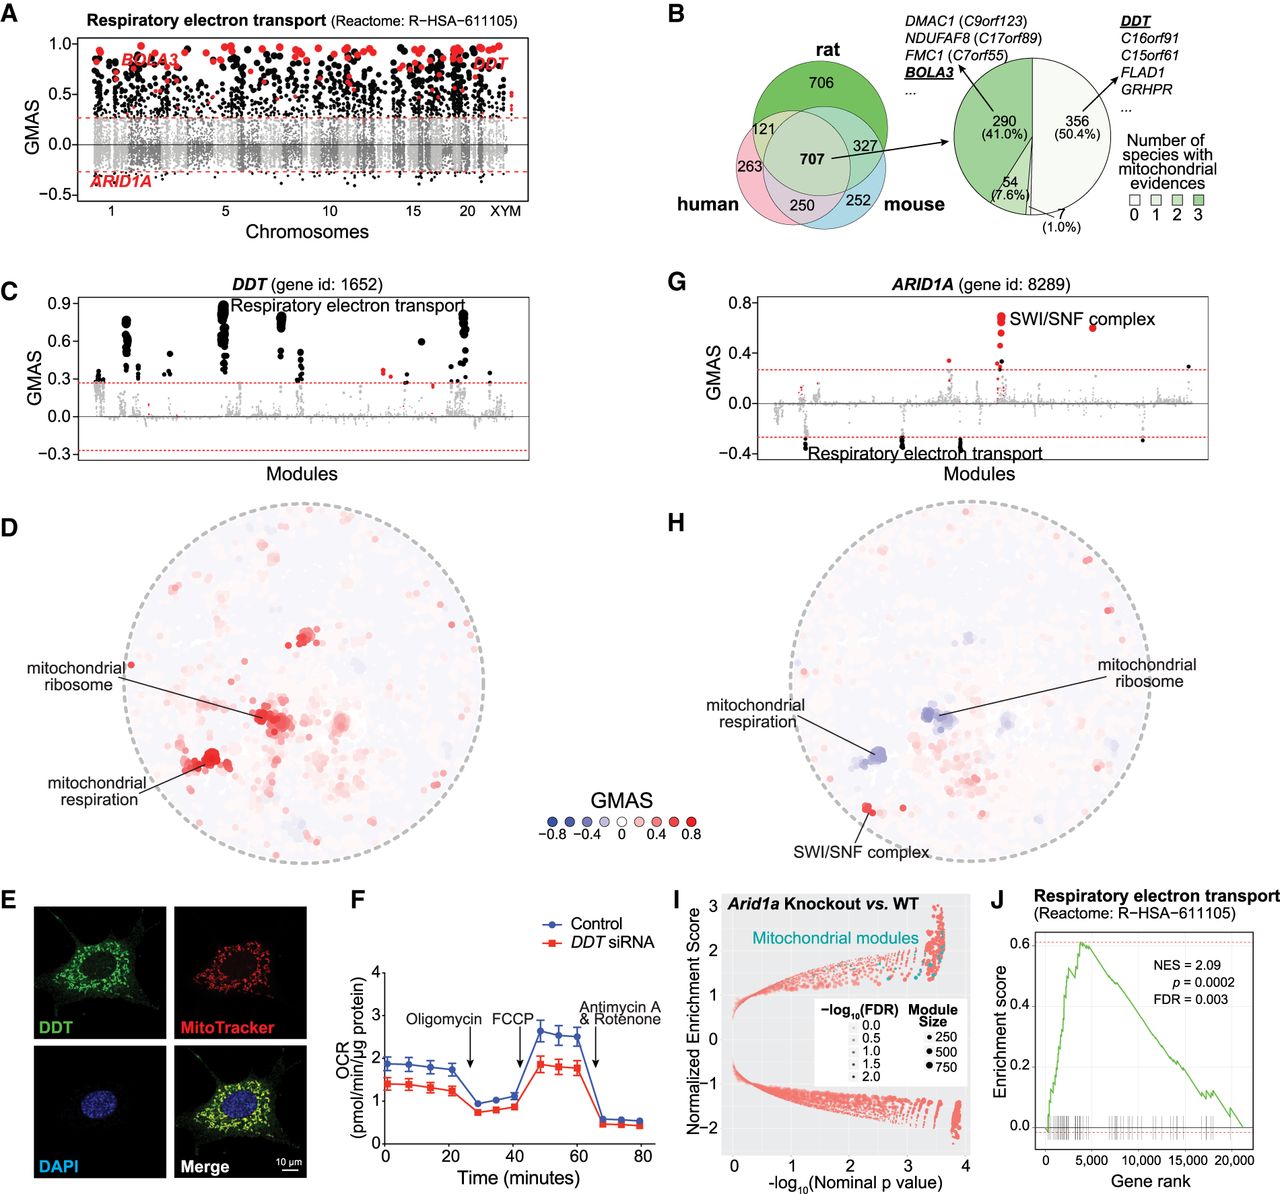
Contrary to most of the existing sources that predict only positive gene-module associations, G-MAD is also able to exploit negative associations. For example, ARID1A exhibits significant negative associations with the respiratory electron transport in human and mouse (Fig. 4A,G,H; Supplemental Fig. S9). ARID1A is a known member of the SWI/SNF family, and the inactivating mutations of SWI/SNF complex genes (mainly SMARCA4 and ARID1A) have recently been linked to increased expression of ETC genes and mitochondrial respiration (Lissanu Deribe et al. 2018). To further validate its regulatory role, we checked an extant public data set from mice with uterus-specific Arid1a knockout (Kim et al. 2015) and confirmed that dysfunction of Arid1a led to the increased expression of mitochondrial genes (Fig. 4I), especially those involved in respiratory electron transport (Fig. 4J).
Module-Module Association Determination (M-MAD)
Biological processes and modules such as metabolism, cellular signaling, biogenesis, and degradation are interconnected and coordinated (Barabási et al. 2011). However, there are few reports exploring the connections between modules in a systematic fashion (Li et al. 2008). Here, we extend G-MAD to develop Module-Module Association Determination (M-MAD) to investigate the connections between modules based on the expression compendia. Results for individual modules against all genes, obtained from G-MAD, were used to compute their associations against all modules. The enrichment scores of all genes for the target module were used as the gene-level statistics to calculate the enrichment against all modules using CAMERA (Wu and Smyth 2012). The resulting enrichment P-values across modules were transformed to 1, 0, or −1 based on the Bonferroni threshold and then meta-analyzed across all data sets to obtain the module-module association scores (MMASs) (Fig. 5A).
Module-Module Association Determination (M-MAD) reveals module connections. (A) Scheme of the M-MAD methodology in detecting module connections. Intermediate results of G-MAD for all modules are further processed and used as the basis of M-MAD. The −log10(P) values of G-MAD for the target module against all genes in each data set are used as the gene statistic for the module, and connections between the target module and all modules are calculated using CAMERA. The results are then meta-analyzed by taking the sample sizes and inter-gene correlations of all data sets to compute the module-module association score (MMAS) between modules. (B) Module association network showing the connections across all modules. Colors of nodes represent the modules defined in the global module similarity network in Figure 1B. Module clusters with respective colors are identified and labeled. Modules used as examples in the following figure panels are highlighted with a circle. (C) Comparison of pairwise module connections derived from module similarities in Figure 1B and associations (from M-MAD) in Figure 5B. A red dashed line is plotted when the pairwise module similarity equals association. The distributions of module similarity and association scores are illustrated in the top and at the right of the plot and are colored in red and blue, respectively. Two examples of novel module connections are encircled. (D,E) Subnetworks showing the association between mitochondrial and proteasomal modules (D), and mitochondrial and histone demethylation modules (E). Edge colors indicate the significance of module connections, with red as positive and blue as negative.
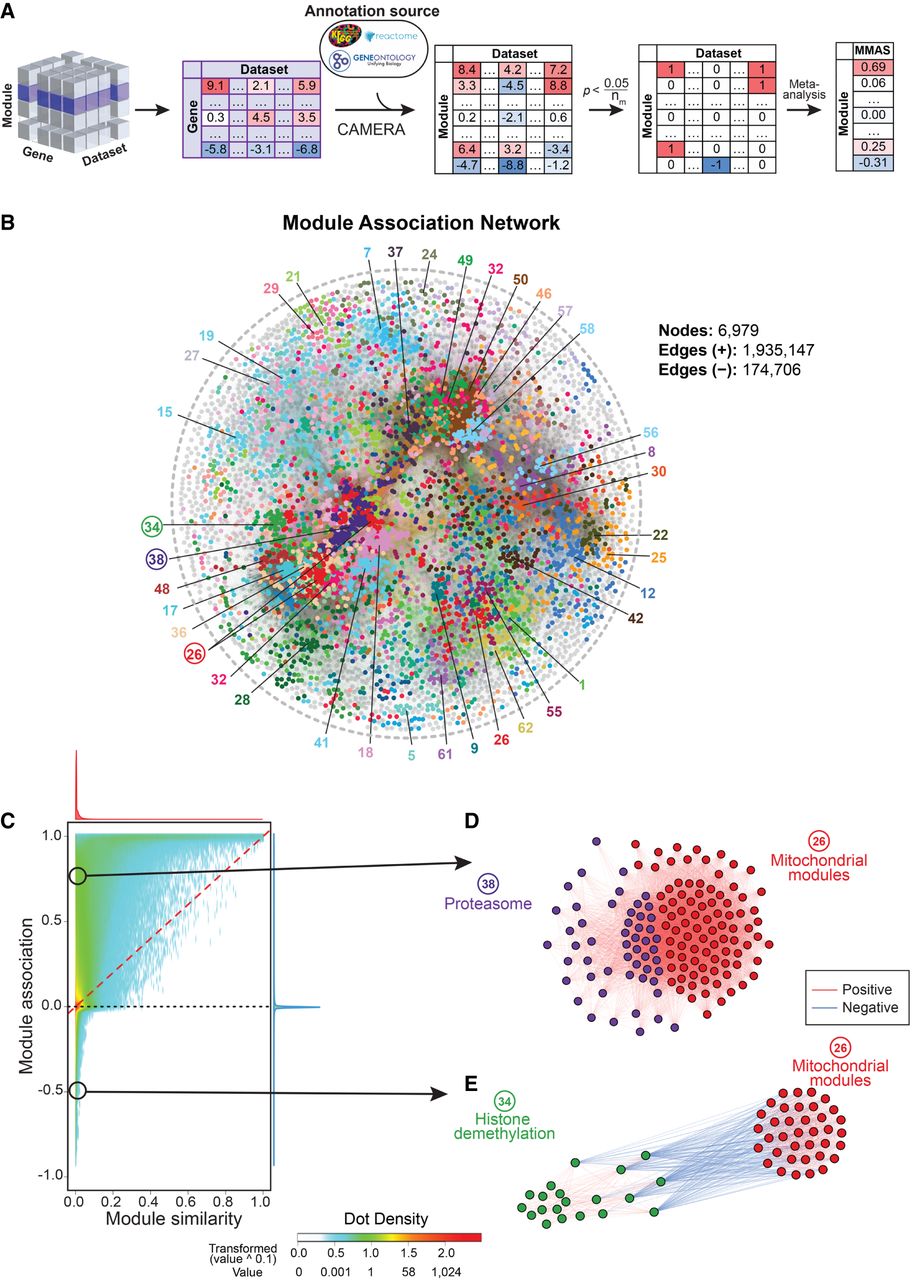
Module-module associations with an absolute MMAS of over 0.268, corresponding to 4% of the total number of module pairs, were considered significant and were used to construct a module association network (Fig. 5B). Modules were represented as nodes with the same colors as the module clusters from Figure 1B. While the module similarity network in Figure 1B is based solely on existing gene annotations, the module association network relies on analyzing the full expression data sets. It can thus reveal new biological connections among modules, which were not included in literature-based annotations. We compared the two networks (Supplemental Fig. S10) obtained from module similarity (Fig. 1B) and module association (Fig. 5B). There are numerous module pairs with no similarity (overlap of annotated genes) but with high association based on expression (M-MAD) (Fig. 5C). Moreover, many module pairs have predicted negative associations (Fig. 5C). Therefore, these results provide a resource for hypothesis generation and validation of the module connections.
By applying M-MAD, we observed a strong positive link between mitochondrial modules and the proteasome (Fig. 5D; Supplemental Fig. S11A–C). Most of the genes encoding for proteasomal subunits exhibit strong association with the ETC in human and mouse (Supplemental Fig. S11G), indicating a conserved coregulatory mechanism. Dysfunction of mitochondria and the ubiquitin-proteasome system (UPS) are hallmarks of aging and aging-related neurodegenerative diseases, such as Alzheimer's, Parkinson's, and Huntington's diseases (Ortega and Lucas 2014; Ross et al. 2015; D'Amico et al. 2017). Abnormalities that perturb the crosstalk between these two modules have been demonstrated to contribute to the pathogenesis of these diseases, and several mechanisms have been proposed (D'Amico et al. 2017; Harrigan et al. 2018). It has also been shown that ETC disruption leads to proteasome impairment (D'Amico et al. 2017), while conversely the inhibition of the UPS causes mitochondrial dysfunction (Ross et al. 2015).
Similar to G-MAD, M-MAD can also predict negative connections between modules. For example, we found strong negative connections between histone demethylation processes and mitochondrial modules (Fig. 5E; Supplemental Fig. S11D–F). The link between epigenetics and mitochondria is a research focus for many groups, including ours (Schroeder et al. 2013; Merkwirth et al. 2016; Tian et al. 2016). It has been reported that mitochondrial dysfunction affects histone methylation and, conversely, histone lysine demethylases can impact mitochondrial functions (Merkwirth et al. 2016). Most of the histone lysine demethylases showed negative associations with the ETC in human and mouse (Supplemental Fig. S11G), suggesting a conserved negative connection between histone demethylation and mitochondrial function.
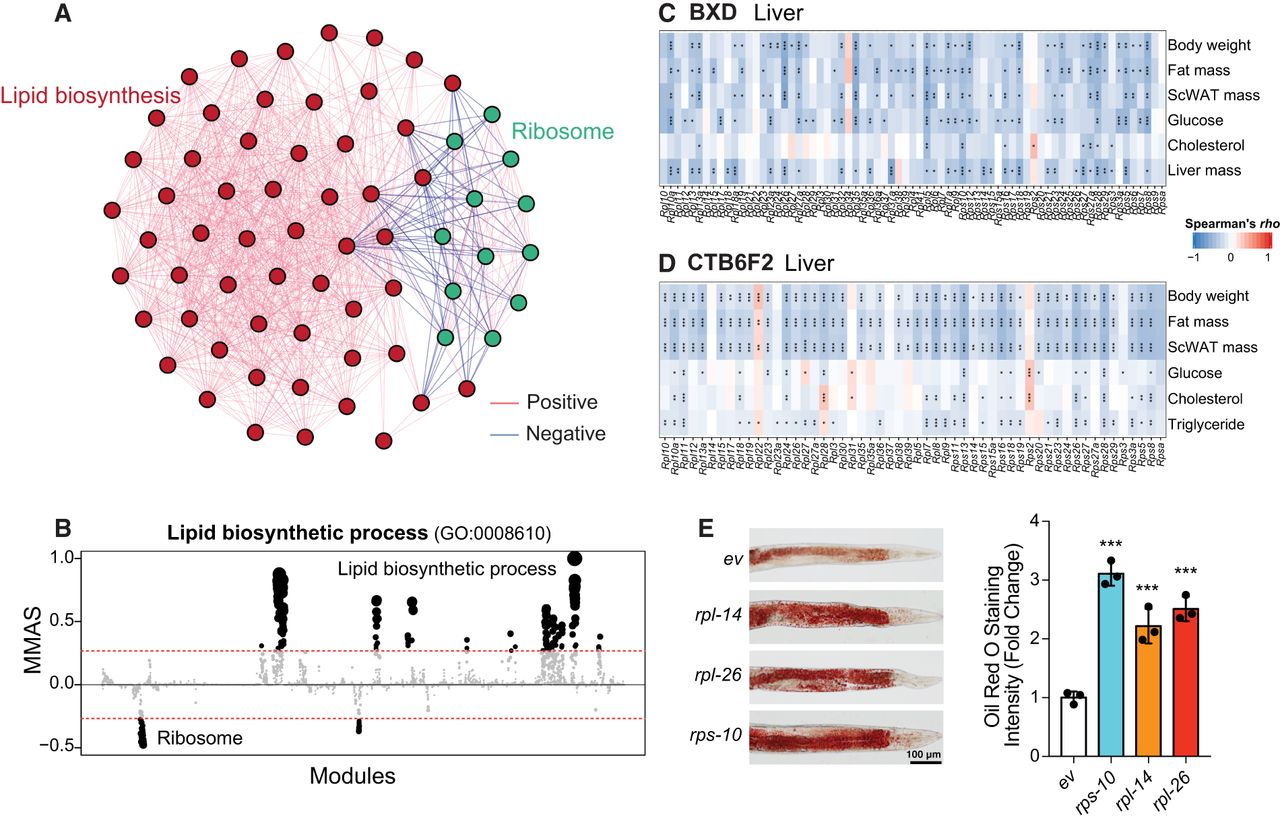
As another example of M-MAD, we investigated modules connected with lipid biosynthetic modules. Of note, ribosome modules exhibited strong negative association with lipid biosynthetic modules (Fig. 6A,B; Supplemental Fig. S12A,B). This is in line with our previous finding that a ribosomal protein, Rpl26, negatively correlates with body weight and fat mass (Li et al. 2018). In support of this connection, liver and adipose transcripts of most ribosomal protein genes negatively correlated with metabolic phenotypes, such as body weight, fat mass, and cholesterol levels, in the BXD mouse cohort (Fig. 6C; Supplemental Fig. S12C; Wu et al. 2014), as well as in a CAST/EiJ and C57BL/6J F2 intercross (Fig. 6D; Supplemental Fig. S12D; Schadt et al. 2008). Finally, RNAi targeting nine of the identified ribosomal protein genes out of total 13 tested led to the accumulation of lipid droplets in C. elegans (Fig. 6E; Supplemental Fig. S12E–G), further validating the robustness of the lipid synthesis-ribosome connection across species.
M-MAD reveals a negative association between the ribosome and lipid biosynthetic modules. (A) Subnetwork for the ribosome and lipid biosynthetic modules. The colors of the edges indicate the significance of module connections, with red as positive and blue as negative. (B) Lipid biosynthetic process negatively connected with ribosomal modules in human. The threshold of significant module-module connection is indicated by the red dashed line. Modules are organized by the module similarities. Dot sizes are proportional to MMASs of the respective modules. (C,D) Transcripts of genes encoding for ribosomal proteins in the liver negatively correlate with metabolic traits, such as body weight, fat mass, plasma glucose and cholesterol levels, in the BXD (C) and CTB6F2 (D) mouse cohorts. (*) P < 0.05, (**) P < 0.01, (***) P < 0.001. (E) Feeding adult C. elegans with RNAi clones of ribosomal proteins, including rps-10, rpl-14, and rpl-26, results in the accumulation of lipids, as reflected by Oil Red O staining. Experimental scheme and additional examples are shown in Supplemental Fig. S12. (***) P < 0.001. (ev) Empty vector. n = 3.
Discussion
Significant efforts in biological research have been devoted to defining the molecular and physiological functions of genes. However, many genes are still not well annotated or even remain uncharacterized (Edwards et al. 2011; Dolgin 2017; Stoeger et al. 2018). Here, we developed an approach, termed G-MAD, to facilitate the identification of novel gene functions and to establish robust connections between genes and modules. Using transcriptome data sets from cohorts ranging from human to mouse, rat, fly, worm, and yeast, we identified millions of gene-module connections, many of which are novel. Unlike most available sources relying on coexpression to predict gene functions, G-MAD can identify not only positive gene-module connections but also negative associations between genes and modules or processes. We illustrated the predictive power of G-MAD by predicting novel mitochondrial protein genes and validated DDT and BOLA3 through experiments. Meanwhile, tissue-specific functions of genes, for example, EHHADH and SLC6A1, can also be identified using data sets derived from respective tissues.
In addition, we extended G-MAD to M-MAD, to uncover connections between modules. Association scores of one module against all genes from G-MAD were used to compute its associations with all modules. Similar to G-MAD, M-MAD can identify both positive and negative module associations. For example, in humans we identified around 2,000,000 associations between all modules, over 170,000 of which were negative. We constructed a module association network based on these connected modules and compared it to the module similarity network. Many of the associated module pairs have low or no similarities in gene compositions. By applying M-MAD on the ETC module, we discovered a conserved connection between mitochondria and the proteasome in various organisms (D'Amico et al. 2017). In addition, we identified negative associations between histone lysine demethylation and mitochondrial modules, underscoring the inverse connection between epigenetic regulation and mitochondrial function (Schroeder et al. 2013; Merkwirth et al. 2016; Tian et al. 2016). Moreover, we discovered and validated a novel negative regulatory role of ribosomal proteins on lipid biosynthesis (Li et al. 2018).
In summary, we described here a set of approaches to identify gene function and module connectivity that we collectively termed GeneBridge to reflect their capacity to bridge genes to biological functions and phenotypes. The GeneBridge toolset is accessible through our open web resource (systems-genetics.org) to the research community for hypothesis generation or validation. It should be noted that we selected a stringent threshold of 0.268 to limit the probability of detecting false positives. Researchers, however, have the possibility to fully explore the results by altering the thresholds on the open web resource. Although only protein-coding genes were included in our analysis, the same approach can be applied to noncoding genes to reveal their potential functions. Similarly, GeneBridge can also be utilized to identify novel gene-disease associations based on known disease-associated genes from databases, such as the Human Disease Ontology (DO) (Schriml et al. 2019) or DisGeNET (Piñero et al. 2017). The GeneBridge toolkit could also be applied to large-scale proteomics data sets after correcting for the background of all measured proteins. Integration of GeneBridge with other well-established databases, such as BioGRID (Stark et al. 2006) and STRING (Szklarczyk et al. 2015), will facilitate the investigation of the connections between genes, modules, and diseases.
Methods
Gene-Module Association Determination (G-MAD)
G-MAD makes use of the PEER-resulted expression residuals (Stegle et al. 2012) of transcriptome data sets from large cohorts (data sets with over 80 samples). The expression levels of the gene-of-interest (target gene T) are used as a continuous trait to test whether a module M is enriched when T is highly expressed or, alternatively, whether it is depleted. The analysis uses the competitive gene set testing method CAMERA, which adjusts for inter-gene correlations (Wu and Smyth 2012). This adjustment is important because, left unadjusted, too many significant results would emerge. To perform CAMERA, we first regress all genes G on T according to the following relationship:
The same procedure was conducted for all the genes in the analyzed data sets to obtain the enrichment P-value matrix between genes and modules in all the data sets. Two types of analyses can be applied on the gene-module P-value matrix. One can extract the P-values for one gene against all modules across the data sets to obtain the association between this gene and all modules; or extract the P-values for one module against all genes to check the association between this module and all genes. To restrict the final scores into the range of (−1, 1), we converted the P-values to 1/0/−1 based on the significance threshold using Bonferroni corrections for each data set (i.e., the thresholds are either when assessing genes for a given module or when assessing modules for a given gene). Gene-module associations with P-values that survived multiple testing corrections were set to 1 or −1, based on the enrichment direction, and 0 otherwise:
In summary, G-MAD employed PEER to remove the influence of covariates, CAMERA to compute P-values between genes and modules in each data set, Bonferroni correction to transform P-values into the range of [−1, 1], and meta-analysis to summarize the results from all data sets.
For the final decision, we computed the true positive rate (percentage of known genes above the threshold against all known genes) and false positive rate (percentage of unknown genes above the threshold against all unknown genes) by varying the threshold of significance. We noticed that decreasing the threshold would increase the true positive rate (TPR) but also the false positive rate (FPR). Therefore, we selected a very stringent threshold for GMAS of 0.268, where only 10% of the known (TPR) and 0.24% of the unknown (FPR) gene-module connections are recovered.
Module-Module Association Determination (M-MAD)
M-MAD takes the association P-value matrix between a target module and all genes computed by CAMERA in all data sets (Fig. 1A, bottom left) and uses the −log10(P) values as a continuous measure to test whether other biological modules are enriched by having genes that are highly associated with the target module. As CAMERA generates P-values that are uniformly distributed, −log10(P) transformed values have an exponential distribution skewed toward 0. The following analysis again uses the competitive gene set testing method CAMERA to compute a P-value for testing the equality of the average transformed values for the genes in the other biological modules compared to all other genes. It will result in a small P-value when many of the genes in the other biological modules are relatively highly connected to the target module. The same analysis is performed for all modules to achieve a final association P-value matrix between modules. The Bonferroni correction was used to correct for the multiple testing errors with as the significance threshold. To constrain the final score into the range between −1 and 1, module-module connections with enrichment P-values that survived multiple testing corrections were allocated 1 or −1, based on the enrichment directions, and 0 otherwise. The results were then meta-analyzed across the data sets, and the module-module association scores (MMAS) were computed as the weighted averages of the connection scores by the sample sizes and inter-gene correlation coefficients within modules across data sets.
Cross-validation
In order to test the predictive performance of G-MAD and compare it with the other methods using coexpression (including WeGET, COXPRESdb, and average r), we performed a cross-validation analysis by removing groups of genes from modules, recomputing the associations between the removed genes and the reduced module, and testing if we can rediscover the removed genes (Szklarczyk et al. 2016). We applied leave-one-out cross-validation for modules with no more than 50 genes, and 10-fold cross-validation for larger modules. The area under the receiver operating characteristic curve is used to estimate the performance of prediction, with an AUC of 1 indicating perfect prediction and 0.5 indicating random guess. Details of the methods are described in the Supplemental Methods.
Validation experiments in vitro and in C. elegans
Some of the novel associations were validated either using cell models or C. elegans. Detailed procedures for the validation experiments are described in Supplemental Methods.
Data access
The data and source codes from this study are available in the Supplemental Code and from https://systems-genetics.org/ and https://github.com/lihaone/GeneBridge, respectively.
Acknowledgments
We thank the research groups who made these data publicly available for systems biology research. We thank the entire J.A. lab for comments and discussions. We thank N. Agarwal for help in data preprocessing. H.L. is the recipient of a doctoral scholarship from the China Scholarship Council. This work was supported by grants from the École Polytechnique Fédérale de Lausanne (EPFL), the European Research Council (ERC-AdG-787702), the Swiss National Science Foundation (SNSF 31003A_179435), the GRL grant of the National Research Foundation of Korea (NRF 2017K1A1A2013124), the AgingX program of the Swiss Initiative for Systems Biology (RTD 2013/153), and the National Institutes of Health (R01AG043930).
Author contributions: Conceptualization: H.L. and J.A.; data curation: H.L.; formal analysis: H.L., D.R., S.M., and J.A.; funding acquisition: R.W.W., M.R-R., K.S., and J.A.; methodology: H.L., D.R., A.K., Q.H., S.M., and J.A.; resources: H.L., F.P.A.D., M.B.S., S.M., and J.A.; software: H.L. and F.P.A.D.; validation: H.L., T.Y.L., C-M.O., A.W.G., and E.K.; visualization: H.L. and J.A.; writing—original draft: H.L. and J.A.; writing—review and editing: H.L., S.M., and J.A.
Notes
[1] Supplementary material [Supplemental material is available for this article.]
[2] Article published online before print. Article, supplemental material, and publication date are at http://www.genome.org/cgi/doi/10.1101/gr.251983.119.
[3] Freely available online through the Genome Research Open Access option.
References
- ↵Arroyo JD, Jourdain AA, Calvo SE, Ballarano CA, Doench JG, Root DE, Mootha VK. 2016. A genome-wide CRISPR death screen identifies genes essential for oxidative phosphorylation. Cell Metab 24: 875–885. 10.1016/j.cmet.2016.08.017
- ↵Ashburner M, Ball CA, Blake JA, Botstein D, Butler H, Cherry JM, Davis AP, Dolinski K, Dwight SS, Eppig JT, 2000. Gene Ontology: tool for the unification of biology. The Gene Ontology Consortium. Nat Genet 25: 25–29. 10.1038/75556
- ↵Austin CP, Battey JF, Bradley A, Bucan M, Capecchi M, Collins FS, Dove WF, Duyk G, Dymecki S, Eppig JT, 2004. The knockout mouse project. Nat Genet 36: 921–924. 10.1038/ng0904-921
- ↵Barabási A-L, Gulbahce N, Loscalzo J. 2011. Network medicine: a network-based approach to human disease. Nat Rev Genet 12: 56–68. 10.1038/nrg2918
- ↵Barrett T, Wilhite SE, Ledoux P, Evangelista C, Kim IF, Tomashevsky M, Marshall KA, Phillippy KH, Sherman PM, Holko M, 2013. NCBI GEO: archive for functional genomics data sets—update. Nucleic Acids Res 41: D991–D995. 10.1093/nar/gks1193
- ↵Bartz F, Kern L, Erz D, Zhu M, Gilbert D, Meinhof T, Wirkner U, Erfle H, Muckenthaler M, Pepperkok R, 2009. Identification of cholesterol-regulating genes by targeted RNAi screening. Cell Metabol 10: 63–75. 10.1016/j.cmet.2009.05.009
- ↵Bastian F, Parmentier G, Roux J, Moretti S, Laudet V, Robinson-Rechavi M. 2008. Bgee: integrating and comparing heterogeneous transcriptome data among species. In Data integration in the life sciences (ed. Bairoch A, ), pp. 124–131. Springer Berlin Heidelberg, Berlin, Heidelberg.
- ↵Calvo SE, Clauser KR, Mootha VK. 2016. MitoCarta2.0: an updated inventory of mammalian mitochondrial proteins. Nucleic Acids Res 44: D1251–D1257. 10.1093/nar/gkv1003
- ↵Cameron JM, Janer A, Levandovskiy V, Mackay N, Rouault TA, Tong W-H, Ogilvie I, Shoubridge EA, Robinson BH. 2011. Mutations in iron-sulfur cluster scaffold genes NFU1 and BOLA3 cause a fatal deficiency of multiple respiratory chain and 2-oxoacid dehydrogenase enzymes. Am J Hum Genet 89: 486–495. 10.1016/j.ajhg.2011.08.011
- ↵Carroll RG, Zasłona Z, Galván-Peña S, Koppe EL, Sévin DC, Angiari S, Triantafilou M, Triantafilou K, Modis LK, O'Neill LA. 2018. An unexpected link between fatty acid synthase and cholesterol synthesis in proinflammatory macrophage activation. J Biol Chem 293: 5509–5521. 10.1074/jbc.RA118.001921
- ↵Carvill GL, McMahon JM, Schneider A, Zemel M, Myers CT, Saykally J, Nguyen J, Robbiano A, Zara F, Specchio N, 2015. Mutations in the GABA transporter SLC6A1 cause epilepsy with myoclonic-atonic seizures. Am J Hum Genet 96: 808–815. 10.1016/j.ajhg.2015.02.016
- ↵Chesler EJ, Lu L, Wang J, Williams RW, Manly KF. 2004. WebQTL: rapid exploratory analysis of gene expression and genetic networks for brain and behavior. Nat Neurosci 7: 485–486. 10.1038/nn0504-485
- ↵Costanzo M, Baryshnikova A, Bellay J, Kim Y, Spear ED, Sevier CS, Ding H, Koh JL, Toufighi K, Mostafavi S, 2010. The genetic landscape of a cell. Science 327: 425–431. 10.1126/science.1180823
- ↵D'Amico D, Sorrentino V, Auwerx J. 2017. Cytosolic proteostasis networks of the mitochondrial stress response. Trends Biochem Sci 42: 712–725. 10.1016/j.tibs.2017.05.002
- ↵Dickinson ME, Flenniken AM, Ji X, Teboul L, Wong MD, White JK, Meehan TF, Weninger WJ, Westerberg H, Adissu H, 2016. High-throughput discovery of novel developmental phenotypes. Nature 537: 508–514. 10.1038/nature19356
- ↵Dolgin E. 2017. The most popular genes in the human genome. Nature 551: 427–431. 10.1038/d41586-017-07291-9
- ↵Edwards AM, Isserlin R, Bader GD, Frye SV, Willson TM, Yu FH. 2011. Too many roads not taken. Nature 470: 163–165. 10.1038/470163a
- ↵Eisen MB, Spellman PT, Brown PO, Botstein D. 1998. Cluster analysis and display of genome-wide expression patterns. Proc Natl Acad Sci 95: 14863–14868. 10.1073/pnas.95.25.14863
- ↵Floyd BJ, Wilkerson EM, Veling MT, Minogue CE, Xia C, Beebe ET, Wrobel RL, Cho H, Kremer LS, Alston CL, 2016. Mitochondrial protein interaction mapping identifies regulators of respiratory chain function. Mol Cell 63: 621–632. 10.1016/j.molcel.2016.06.033
- ↵Greene CS, Krishnan A, Wong AK, Ricciotti E, Zelaya RA, Himmelstein DS, Zhang R, Hartmann BM, Zaslavsky E, Sealfon SC, 2015. Understanding multicellular function and disease with human tissue-specific networks. Nat Genet 47: 569–576. 10.1038/ng.3259
- ↵Harrigan JA, Jacq X, Martin NM, Jackson SP. 2018. Deubiquitylating enzymes and drug discovery: emerging opportunities. Nat Rev Drug Disc 17: 57–78. 10.1038/nrd.2017.152
- ↵Hein MY, Hubner NC, Poser I, Cox J, Nagaraj N, Toyoda Y, Gak IA, Weisswange I, Mansfeld J, Buchholz F, 2015. A human interactome in three quantitative dimensions organized by stoichiometries and abundances. Cell 163: 712–723. 10.1016/j.cell.2015.09.053
- ↵Horlbeck MA, Xu A, Wang M, Bennett NK, Park CY, Bogdanoff D, Adamson B, Chow ED, Kampmann M, Peterson TR, 2018. Mapping the genetic landscape of human cells. Cell 174: 953–967.e22. 10.1016/j.cell.2018.06.010
- ↵Huttlin EL, Bruckner RJ, Paulo JA, Cannon JR, Ting L, Baltier K, Colby G, Gebreab F, Gygi MP, Parzen H, 2017. Architecture of the human interactome defines protein communities and disease networks. Nature 545: 505–509. 10.1038/nature22366
- ↵Jiang Y, Oron TR, Clark WT, Bankapur AR, D'Andrea D, Lepore R, Funk CS, Kahanda I, Verspoor KM, Ben-Hur A, 2016. An expanded evaluation of protein function prediction methods shows an improvement in accuracy. Genome Biol 17: 184. 10.1186/s13059-016-1037-6
- ↵Khatri P, Sirota M, Butte AJ. 2012. Ten years of pathway analysis: current approaches and outstanding challenges. PLoS Comput Biol 8: e1002375. 10.1371/journal.pcbi.1002375
- ↵Kim TH, Yoo J-Y, Wang Z, Lydon JP, Khatri S, Hawkins SM, Leach RE, Fazleabas AT, Young SL, Lessey BA, 2015. ARID1A is essential for endometrial function during early pregnancy. PLoS Genet 11: e1005537. 10.1371/journal.pgen.1005537
- ↵Klootwijk ED, Reichold M, Helip-Wooley A, Tolaymat A, Broeker C, Robinette SL, Reinders J, Peindl D, Renner K, Eberhart K, 2014. Mistargeting of peroxisomal EHHADH and inherited renal Fanconi's syndrome. N Engl J Med 370: 129–138. 10.1056/NEJMoa1307581
- ↵Kolesnikov N, Hastings E, Keays M, Melnichuk O, Tang YA, Williams E, Dylag M, Kurbatova N, Brandizi M, Burdett T, 2015. ArrayExpress update—simplifying data submissions. Nucleic Acids Res 43: D1113–D1116. 10.1093/nar/gku1057
- ↵Langfelder P, Horvath S. 2008. WGCNA: an R package for weighted correlation network analysis. BMC Bioinform 9: 559. 10.1186/1471-2105-9-559
- ↵Lefebvre-Legendre L, Vaillier J, Benabdelhak H, Velours J, Slonimski PP, di Rago J-P. 2001. Identification of a nuclear gene (FMC1) required for the assembly/stability of yeast mitochondrial F1-ATPase in heat stress conditions. J Biol Chem 276: 6789–6796. 10.1074/jbc.M009557200
- ↵Li Y, Agarwal P, Rajagopalan D. 2008. A global pathway crosstalk network. Bioinformatics 24: 1442–1447. 10.1093/bioinformatics/btn200
- ↵Li Y, Calvo SE, Gutman R, Liu JS, Mootha VK. 2014. Expansion of biological pathways based on evolutionary inference. Cell 158: 213–225. 10.1016/j.cell.2014.05.034
- ↵Li Y, Jourdain AA, Calvo SE, Liu JS, Mootha VK. 2017. CLIC, a tool for expanding biological pathways based on co-expression across thousands of datasets. PLoS Comput Biol 13: e1005653. 10.1371/journal.pcbi.1005653
- ↵Li H, Wang X, Rukina D, Huang Q, Lin T, Sorrentino V, Zhang H, Bou Sleiman M, Arends D, McDaid A, 2018. An integrated systems genetics and omics toolkit to probe gene function. Cell Syst 6: 90–102.e4. 10.1016/j.cels.2017.10.016
- ↵Lissanu Deribe Y, Sun Y, Terranova C, Khan F, Martinez-Ledesma J, Gay J, Gao G, Mullinax RA, Khor T, Feng N, 2018. Mutations in the SWI/SNF complex induce a targetable dependence on oxidative phosphorylation in lung cancer. Nat Med 24: 1047–1057. 10.1038/s41591-018-0019-5
- ↵Marcotte EM, Pellegrini M, Ng HL, Rice DW, Yeates TO, Eisenberg D. 1999. Detecting protein function and protein-protein interactions from genome sequences. Science 285: 751–753. 10.1126/science.285.5428.751
- ↵Merkwirth C, Jovaisaite V, Durieux J, Matilainen O, Jordan SD, Quiros PM, Steffen KK, Williams EG, Mouchiroud L, Tronnes SU, 2016. Two conserved histone demethylases regulate mitochondrial stress-induced longevity. Cell 165: 1209–1223. 10.1016/j.cell.2016.04.012
- ↵Obayashi T, Kagaya Y, Aoki Y, Tadaka S, Kinoshita K. 2019. COXPRESdb v7: a gene coexpression database for 11 animal species supported by 23 coexpression platforms for technical evaluation and evolutionary inference. Nucleic Acids Res 47: D55–D62. 10.1093/nar/gky1155
- ↵Ortega Z, Lucas JJ. 2014. Ubiquitin-proteasome system involvement in Huntington's disease. Front Mol Neurosci 7: 77. 10.3389/fnmol.2014.00077
- ↵Pandey AK, Lu L, Wang X, Homayouni R, Williams RW. 2014. Functionally enigmatic genes: a case study of the brain ignorome. PLoS One 9: e88889. 10.1371/journal.pone.0088889
- ↵Pellegrini M, Marcotte EM, Thompson MJ, Eisenberg D, Yeates TO. 1999. Assigning protein functions by comparative genome analysis: protein phylogenetic profiles. Proc Natl Acad Sci 96: 4285–4288. 10.1073/pnas.96.8.4285
- ↵Piñero J, Bravo A, Queralt-Rosinach N, Gutiérrez-Sacristán A, Deu-Pons J, Centeno E, García-García J, Sanz F, Furlong LI. 2017. DisGeNET: a comprehensive platform integrating information on human disease-associated genes and variants. Nucleic Acids Res 45: D833–D839. 10.1093/nar/gkw943
- ↵Radivojac P, Clark WT, Oron TR, Schnoes AM, Wittkop T, Sokolov A, Graim K, Funk C, Verspoor K, Ben-Hur A, 2013. A large-scale evaluation of computational protein function prediction. Nat Methods 10: 221–227. 10.1038/nmeth.2340
- ↵Rolland T, Taşan M, Charloteaux B, Pevzner SJ, Zhong Q, Sahni N, Yi S, Lemmens I, Fontanillo C, Mosca R, 2014. A proteome-scale map of the human interactome network. Cell 159: 1212–1226. 10.1016/j.cell.2014.10.050
- ↵Ross JM, Olson L, Coppotelli G. 2015. Mitochondrial and ubiquitin proteasome system dysfunction in ageing and disease: two sides of the same coin? Int J Mol Sci 16: 19458–19476. 10.3390/ijms160819458
- ↵Roy A, Kucukural A, Zhang Y. 2010. I-TASSER: a unified platform for automated protein structure and function prediction. Nat Protoc 5: 725–738. 10.1038/nprot.2010.5
- ↵Schadt EE, Molony C, Chudin E, Hao K, Yang X, Lum PY, Kasarskis A, Zhang B, Wang S, Suver C, 2008. Mapping the genetic architecture of gene expression in human liver. PLoS Biol 6: e107. 10.1371/journal.pbio.0060107
- ↵Schriml LM, Mitraka E, Munro J, Tauber B, Schor M, Nickle L, Felix V, Jeng L, Bearer C, Lichenstein R, 2019. Human Disease Ontology 2018 update: classification, content and workflow expansion. Nucleic Acids Res 47: D955–D962. 10.1093/nar/gky1032
- ↵Schroeder EA, Raimundo N, Shadel GS. 2013. Epigenetic silencing mediates mitochondria stress-induced longevity. Cell Metabol 17: 954–964. 10.1016/j.cmet.2013.04.003
- ↵Stark C, Breitkreutz BJ, Reguly T, Boucher L, Breitkreutz A, Tyers M. 2006. BioGRID: a general repository for interaction datasets. Nucleic Acids Res 34: D535–D539. 10.1093/nar/gkj109
- ↵Stegle O, Parts L, Piipari M, Winn J, Durbin R. 2012. Using probabilistic estimation of expression residuals (PEER) to obtain increased power and interpretability of gene expression analyses. Nat Protoc 7: 500–507. 10.1038/nprot.2011.457
- ↵Stoeger T, Gerlach M, Morimoto RI, Nunes Amaral LA. 2018. Large-scale investigation of the reasons why potentially important genes are ignored. PLoS Biol 16: e2006643. 10.1371/journal.pbio.2006643
- ↵Stroud DA, Surgenor EE, Formosa LE, Reljic B, Frazier AE, Dibley MG, Osellame LD, Stait T, Beilharz TH, Thorburn DR, 2016. Accessory subunits are integral for assembly and function of human mitochondrial complex I. Nature 538: 123–126. 10.1038/nature19754
- ↵Subramanian A, Tamayo P, Mootha VK, Mukherjee S, Ebert BL, Gillette MA, Paulovich A, Pomeroy SL, Golub TR, Lander ES, 2005. Gene set enrichment analysis: a knowledge-based approach for interpreting genome-wide expression profiles. Proc Natl Acad Sci 102: 15545–15550. 10.1073/pnas.0506580102
- ↵Szklarczyk D, Franceschini A, Wyder S, Forslund K, Heller D, Huerta-Cepas J, Simonovic M, Roth A, Santos A, Tsafou KP, 2015. STRING v10: protein-protein interaction networks, integrated over the tree of life. Nucleic Acids Res 43: D447–D452. 10.1093/nar/gku1003
- ↵Szklarczyk R, Megchelenbrink W, Cizek P, Ledent M, Velemans G, Szklarczyk D, Huynen MA. 2016. WeGET: predicting new genes for molecular systems by weighted co-expression. Nucleic Acids Res 44: D567–D573. 10.1093/nar/gkv1228
- ↵Tabach Y, Billi AC, Hayes GD, Newman MA, Zuk O, Gabel H, Kamath R, Yacoby K, Chapman B, Garcia SM, 2013. Identification of small RNA pathway genes using patterns of phylogenetic conservation and divergence. Nature 493: 694–698. 10.1038/nature11779
- ↵Theisen DJ, Davidson JT, Briseño CG, Gargaro M, Lauron EJ, Wang Q, Desai P, Durai V, Bagadia P, Brickner JR, 2018. WDFY4 is required for cross-presentation in response to viral and tumor antigens. Science 362: 694–699. 10.1126/science.aat5030
- ↵Tian Y, Garcia G, Bian Q, Steffen KK, Joe L, Wolff S, Meyer BJ, Dillin A. 2016. Mitochondrial stress induces chromatin reorganization to promote longevity and UPRmt. Cell 165: 1197–1208. 10.1016/j.cell.2016.04.011
- ↵Tong AH, Lesage G, Bader GD, Ding H, Xu H, Xin X, Young J, Berriz GF, Brost RL, Chang M, 2004. Global mapping of the yeast genetic interaction network. Science 303: 808–813. 10.1126/science.1091317
- ↵Uhlen M, Fagerberg L, Hallstrom BM, Lindskog C, Oksvold P, Mardinoglu A, Sivertsson A, Kampf C, Sjostedt E, Asplund A, 2015. Proteomics. Tissue-based map of the human proteome. Science 347: 1260419. 10.1126/science.1260419
- ↵van Dam S, Craig T, de Magalhães JP. 2015. GeneFriends: a human RNA-seq-based gene and transcript co-expression database. Nucleic Acids Res 43: D1124–D1132. 10.1093/nar/gku1042
- ↵Warde-Farley D, Donaldson SL, Comes O, Zuberi K, Badrawi R, Chao P, Franz M, Grouios C, Kazi F, Lopes CT, 2010. The GeneMANIA prediction server: biological network integration for gene prioritization and predicting gene function. Nucleic Acids Res 38: W214–W220. 10.1093/nar/gkq537
- ↵Williams EG, Auwerx J. 2015. The convergence of systems and reductionist approaches in complex trait analysis. Cell 162: 23–32. 10.1016/j.cell.2015.06.024
- ↵Williams EG, Wu Y, Ryu D, Kim JY, Lan J, Hasan M, Wolski W, Jha P, Halter C, Auwerx J, 2018. Quantifying and localizing the mitochondrial proteome across five tissues in a mouse population. Mol Cell Proteomics 17: 1766–1777. 10.1074/mcp.RA118.000554.
- ↵Wu D, Smyth GK. 2012. Camera: a competitive gene set test accounting for inter-gene correlation. Nucleic Acids Res 40: e133. 10.1093/nar/gks461
- ↵Wu Y, Williams EG, Dubuis S, Mottis A, Jovaisaite V, Houten SM, Argmann CA, Faridi P, Wolski W, Kutalik Z, 2014. Multilayered genetic and omics dissection of mitochondrial activity in a mouse reference population. Cell 158: 1415–1430. 10.1016/j.cell.2014.07.039
- ↵Zhu Q, Wong AK, Krishnan A, Aure MR, Tadych A, Zhang R, Corney DC, Greene CS, Bongo LA, Kristensen VN, 2015. Targeted exploration and analysis of large cross-platform human transcriptomic compendia. Nat Methods 12: 211–214. 10.1038/nmeth.3249