
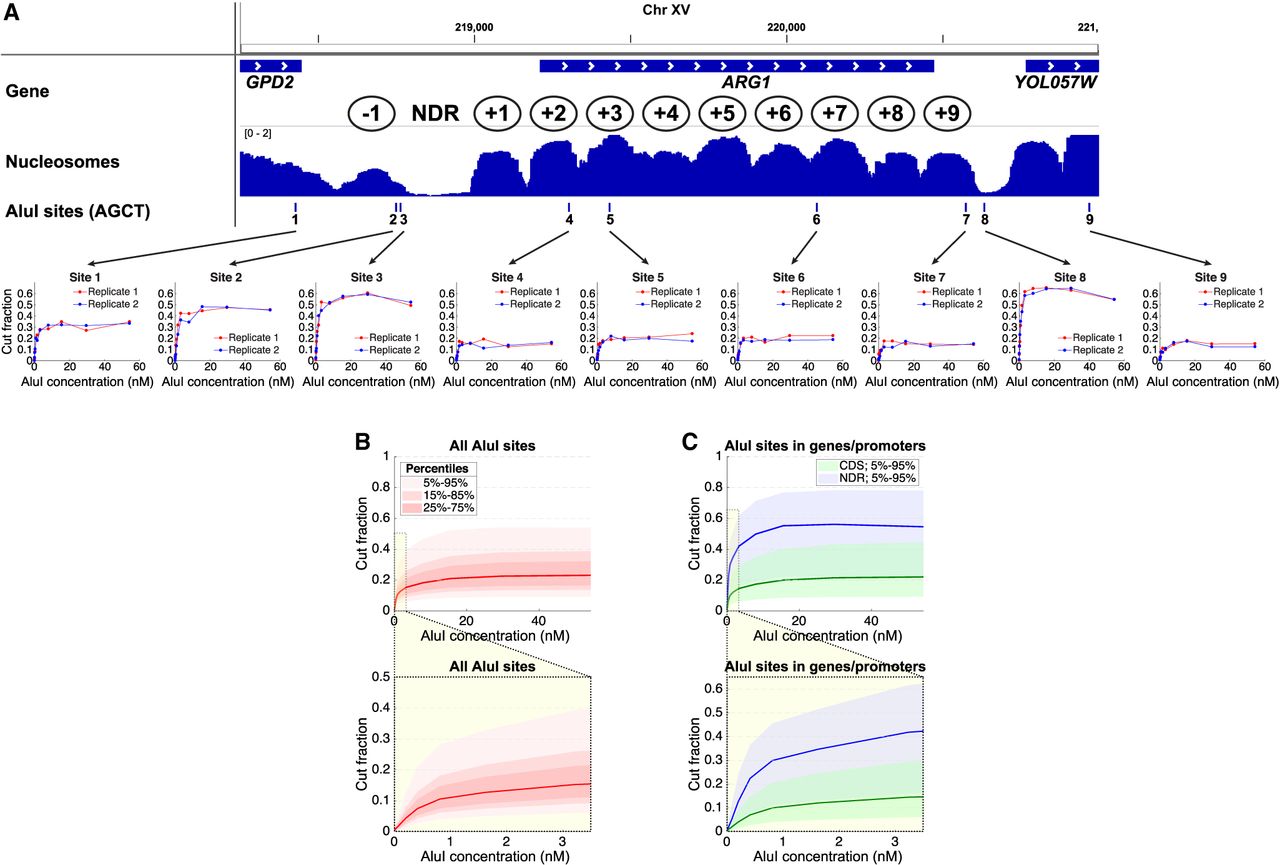
DNA accessibility in yeast varies from cell to cell. (A) AluI accessibility of the ARG1 gene in arrested haploid yeast cells. (Upper panel) Nucleosome occupancy (MNase-seq data) (Ocampo et al. 2016) in wild-type cells normalized to the genomic average (=1). Ovals indicate approximate nucleosome positions. (Lower panel) AluI digestion at each of nine sites (data for two independent experiments are shown). The plateau value is a measure of the fraction of cells in which the AluI site is accessible. Each site is accessible in some cells and inaccessible in the rest. (B) Digestion kinetics for all approximately 40,000 AluI sites as a function of [AluI] (11 digestion points) for haploid cells arrested with α-factor. Red line indicates median level of digestion; pink shading, data ranges. The lightest pink area includes 90% of the AluI sites (i.e., the 5%–95% data range, which excludes the 5% of AluI sites that are the least cut and the 5% of sites that are the most cut). Below the main panel: an expansion of the plot to show the initial stages of digestion. (C) Kinetics for AluI sites in gene bodies (between start and stop codons) and promoter NDRs defined using the positions of the +1 and −1 nucleosomes (Chereji et al. 2018). Blue line indicates median level of digestion in NDRs; green line, median level of digestion in gene bodies.


