
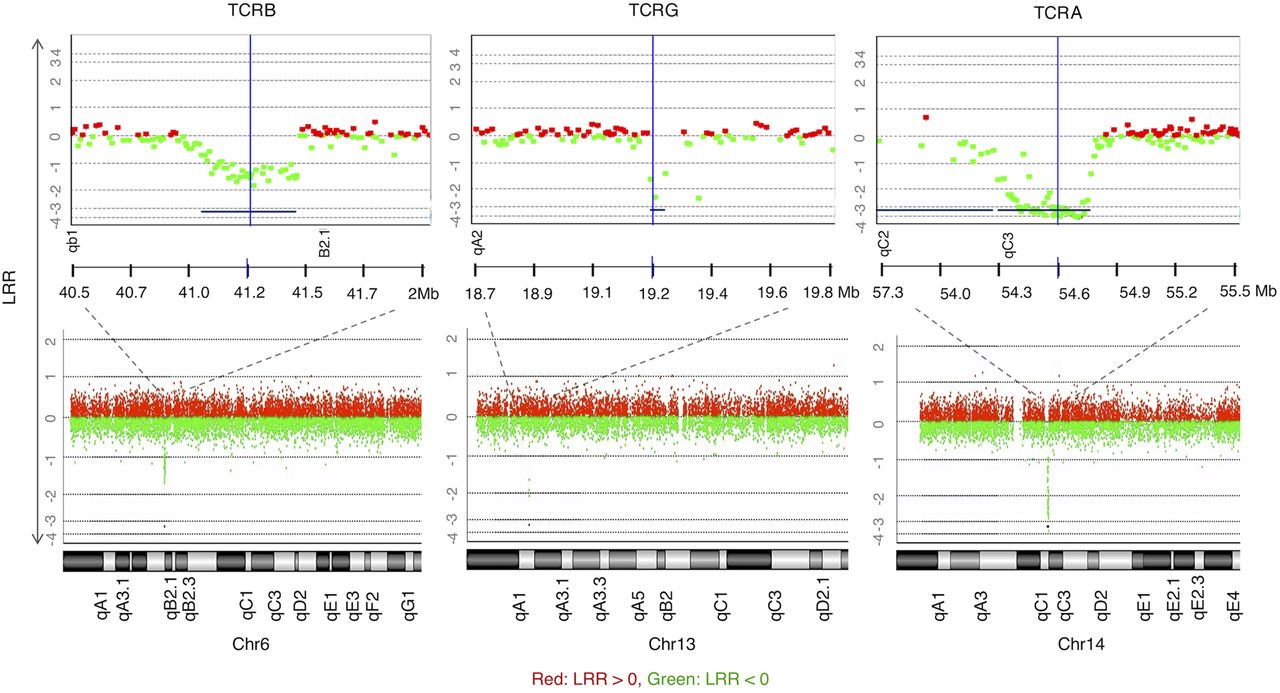
Figure 2.
CGH array results demonstrating positive controls for T cell CNAs observed in all samples (to illustrate, M1 is shown here), copy loss (regions represented by lines below the graph) at regions of TCR genomic rearrangements of the β-chain on Chr 6, γ-chain on Chr 13, and α-chain on Chr 14 (DLRSpread value: M1: 0.21). LRR (log relative ratio) is the base 2 log of the Cy3/Cy5 ratio.


