
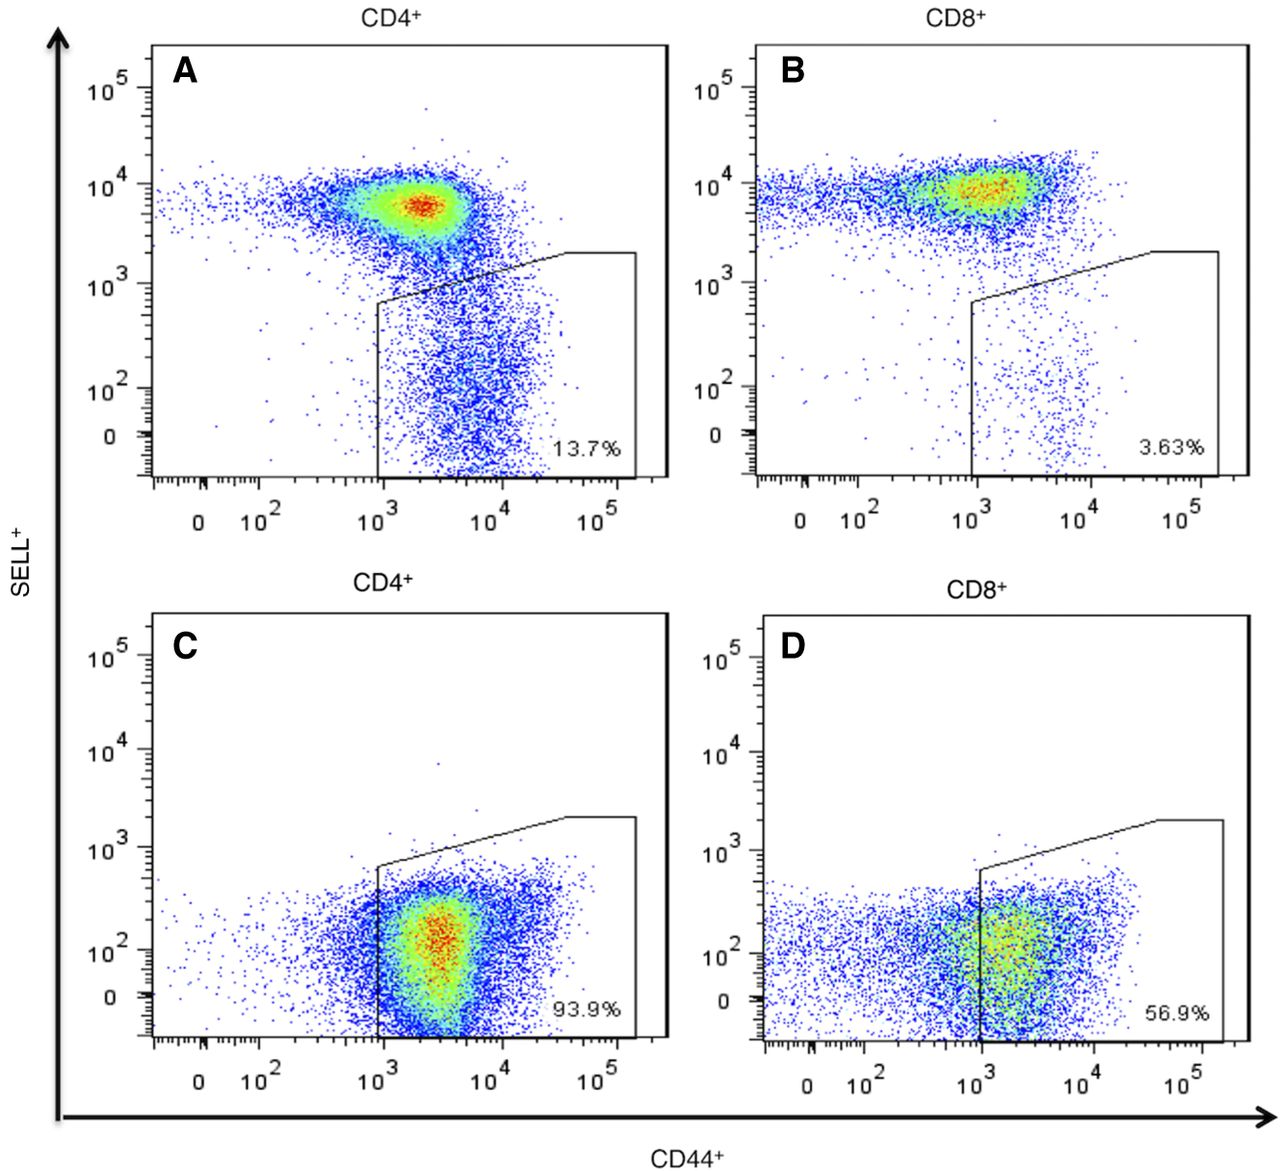
Figure 1.
Flow-sorting of memory CD4+ and CD8+ T cells from NOD mouse PLNs using the established surface-marker phenotype SELLneg/CD44hi. (A,B) Normal profile observed in most samples of CD4+ and CD8+ T cells (n = 19). (C,D) Profile of sorted memory cells in six animals (n = 6) in which all cells were SELLneg with CD44+ in the lower part of the range for memory cells.


