
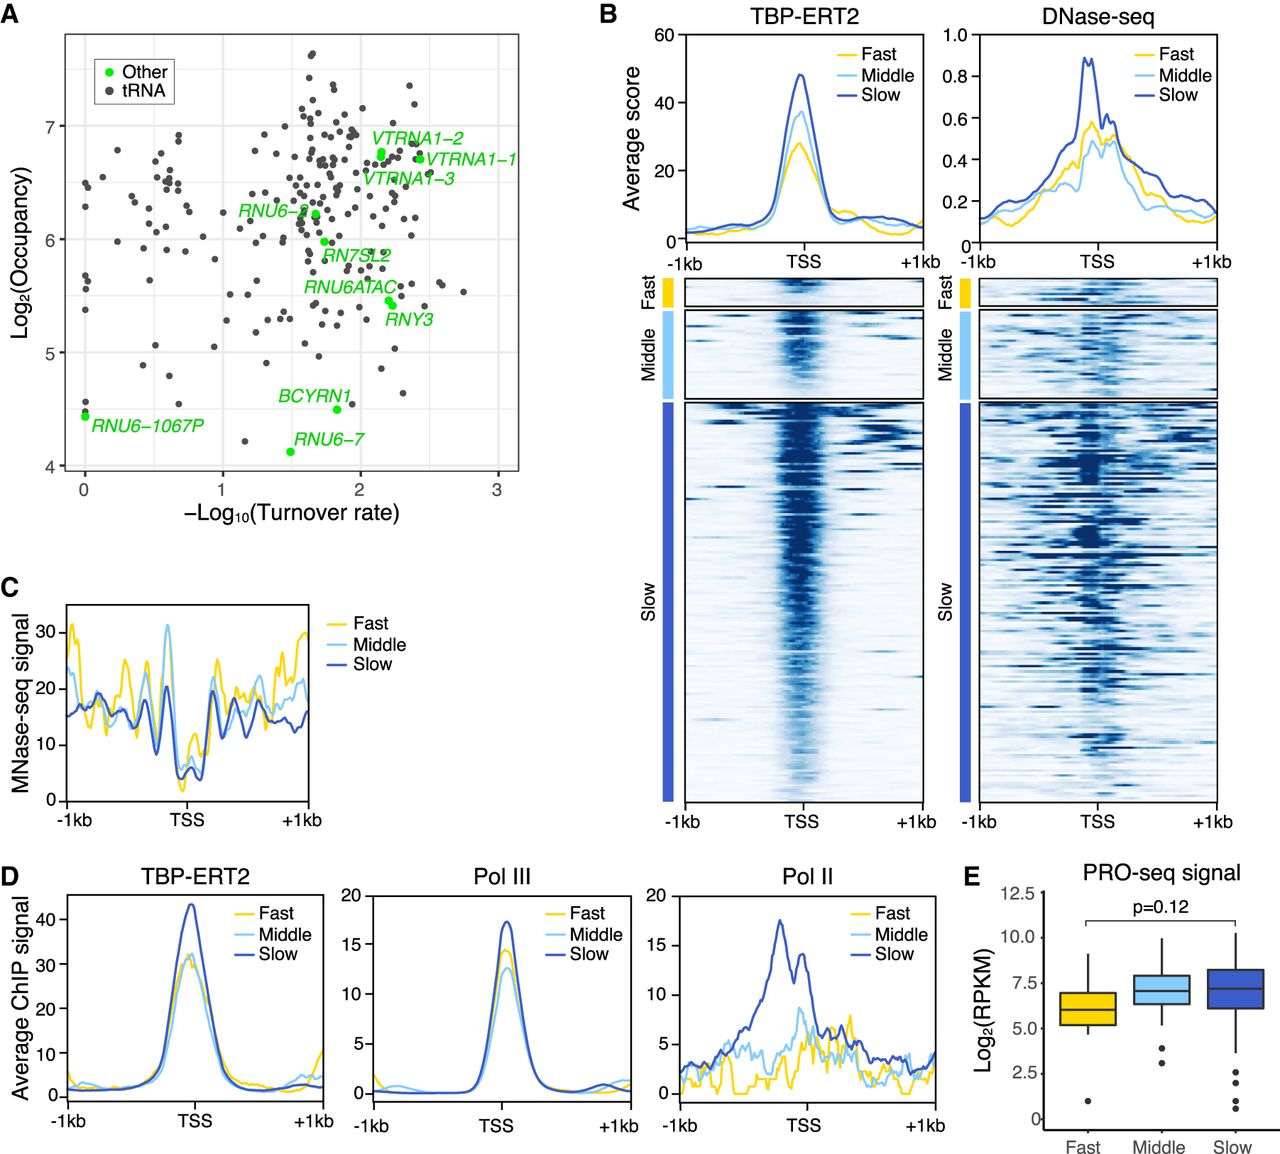
Figure 6.
Pol III promoters with slow TBP binding dynamics have less nucleosomes and higher Pol III recruitment. (A) Scatter plot of TBP-ERT2 peaks annotated as Pol III genes in log2TBP-ERT2 occupancy versus log10TBP-ERT2 binding turnover rate. (B) Means and heat maps of TBP-ERT2 binding and DNase-seq signal on each target site near Pol III genes. (C) Means of MNase-seq (Sathira et al. 2010) signal along −1 kb to +1 kb from the TSS in each class. (D) Means of TB P-ERT2, Pol III (POLR3A), and Pol II binding (Choquet et al. 2019) along −1 kb to +1 kb from the TSSs of tRNA genes in each class. (E) Box plot of PRO-seq signal (Woo et al. 2018) at tRNA genes in each class.


