
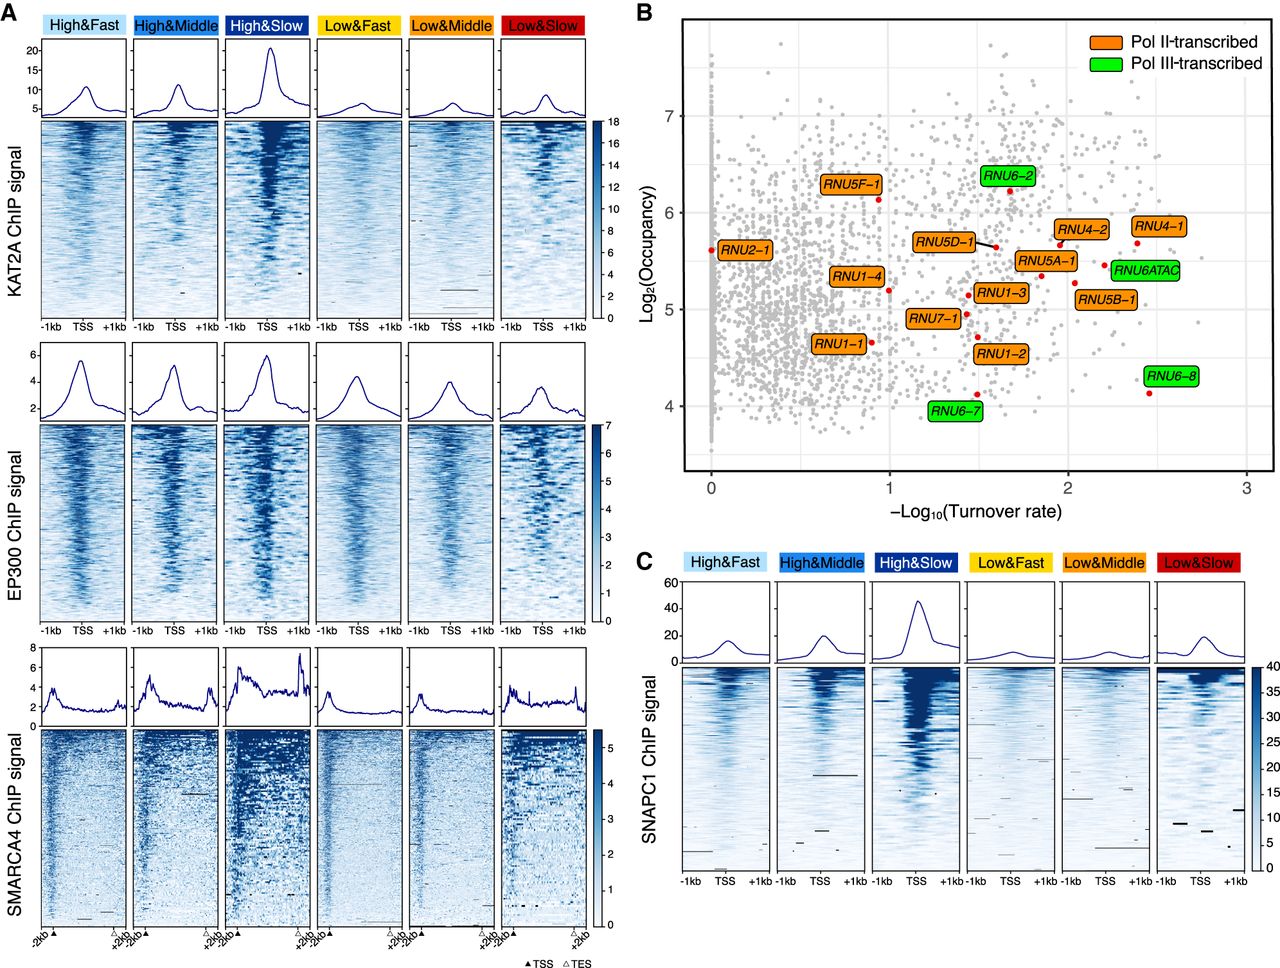
Figure 5.
KAT2A, SMARCA4, and SNAPC1 are enriched in genes with slow TBP binding dynamics. (A) Means and heat maps of KAT2A (top), EP300 (middle), and SMARCA4 (bottom) binding on each target site. (B) Distribution of snRNA genes (red) in the scatter plot of log2TBP-ERT2 occupancy versus log10TBP-ERT2 binding turnover rate. Orange and green, respectively, indicate Pol II- and Pol III-transcribed snRNA. (C) Means and heat maps of SNAPC1 binding (Baillat et al. 2012) on each target site (snRNA genes have been excluded).


