
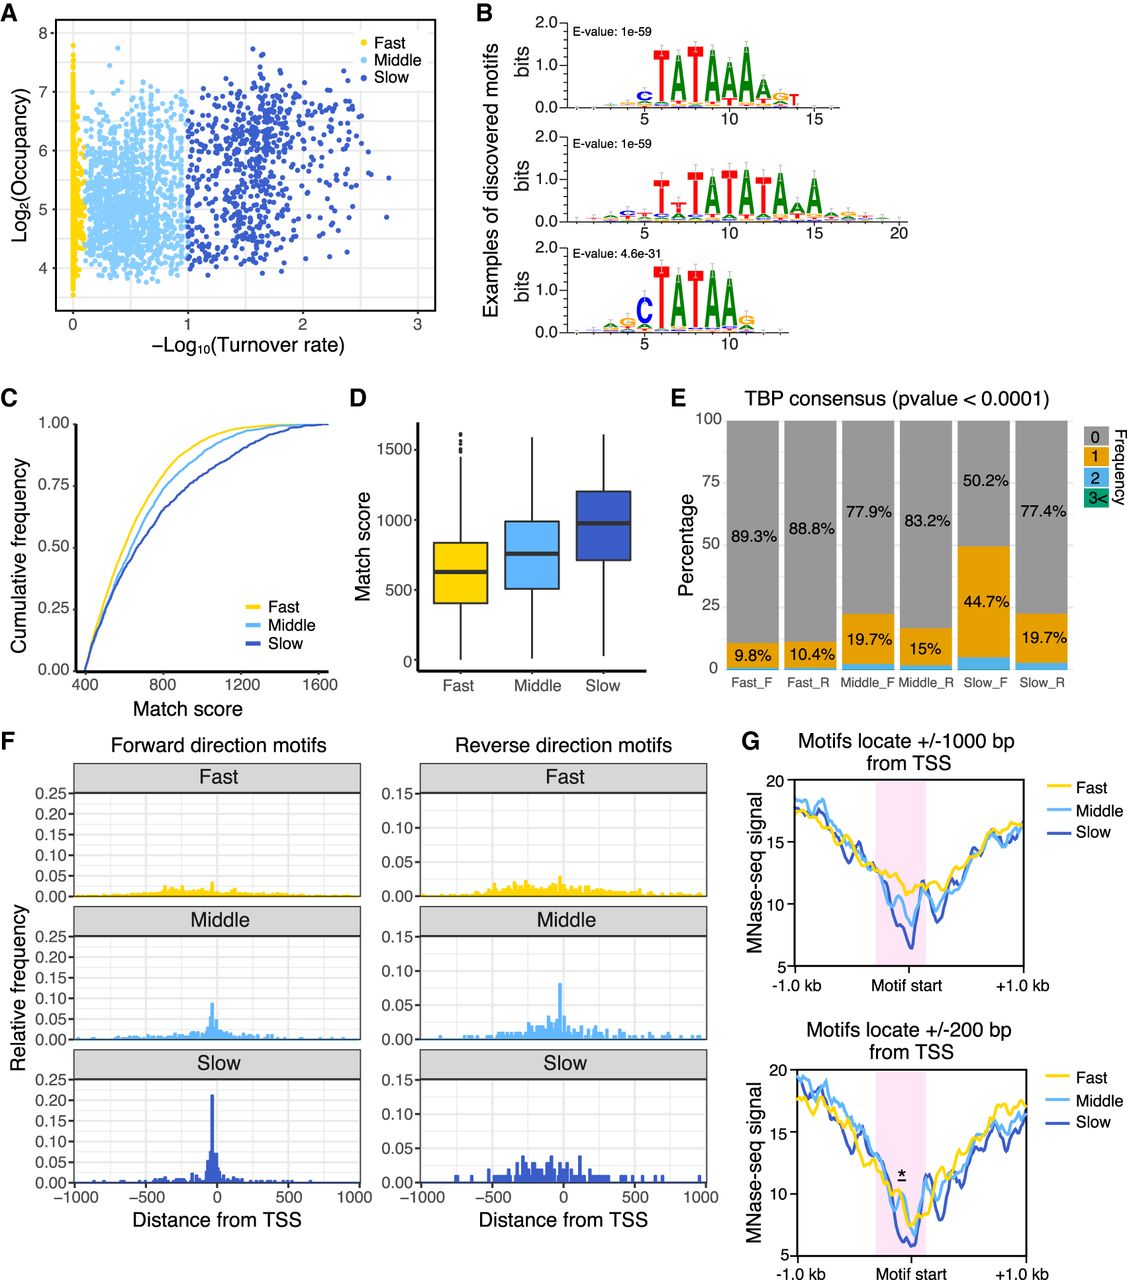
Pol II promoters with slow TBP turnover preferentially contain the consensus TATA sequence and fewer nucleosomes. (A) Scatter plot of TBP-ERT2 peaks annotated as Pol II promoters in log2TBP-ERT2 occupancy versus −log10TBP-ERT2 binding turnover rate. Colors indicate the classes categorized based on the binding turnover rates. (B) Top three DNA motifs enriched in the slow turnover class. (C) Cumulative frequency of match score to the position weight matrix of TATA consensus motif. (D) Box plot of TATA consensus match scores to a forward-oriented consensus sequence for the indicated classes of promoters. (E) Percentage of promoters that have strong (P < 0.0001) hit sequences to TATA consensus motif, with colors indicating the number of TATA sequences in each promoter in the forward (F) or reverse (R) direction with respect to the downstream genes. (F) Position of TATA sequences in forward or reverse direction within 1 kb upstream of or downstream from the TSS. (G) MNase-seq (Sathira et al. 2010) signal around hit sequences located in −1 kb to +1 kb from the TSS (top) and −200 bp to +200 bp from the TSS (bottom). Red shaded areas represent regions having marked differences of MNase-seq signals between classes. Asterisk in the bottom panel represents the region showing significant differences (Student's t-test, P < 0.001).


