
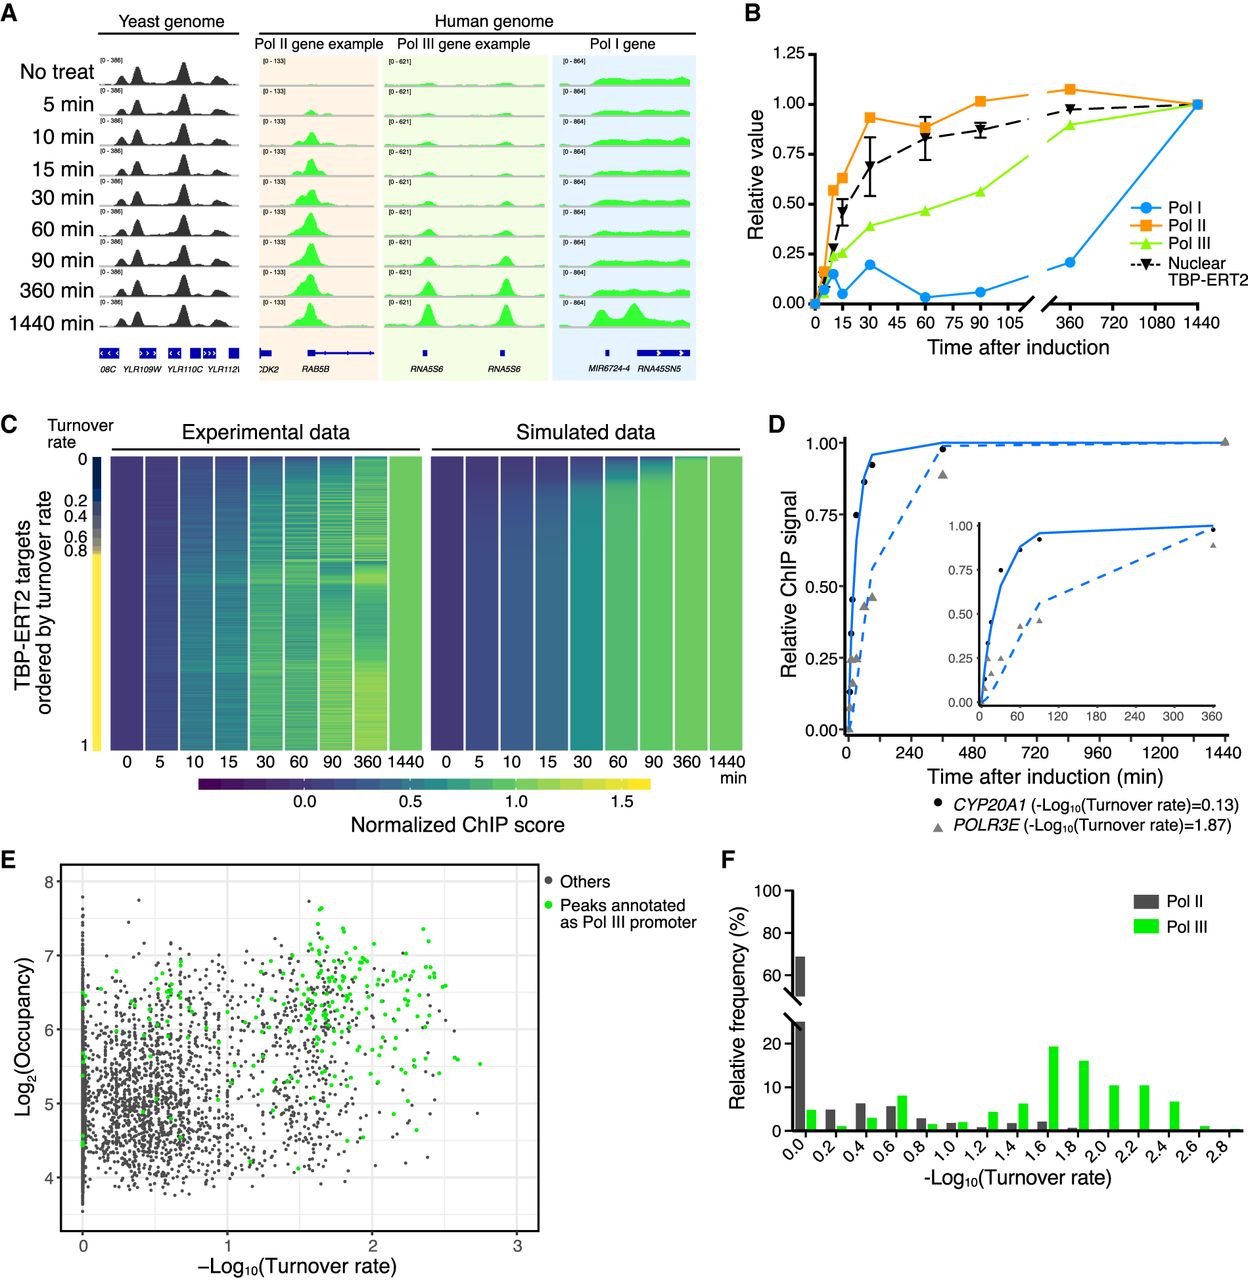
Figure 2.
Time-course ChIP-seq analysis. (A) Examples of human loci bound by TBP-ERT2 and yeast loci bound by 3HA-TBP (spike-in). (B) TBP-ERT2 binding to the composite average of Pol I, Pol II, and Pol III promoters relative to the 1440-min sample. (C) TBP-ERT2 binding relative to the 1440-min sample (left) and simulated relative TBP-ERT2 binding by using turnover rate (right) of all detected peaks. Peaks are ordered by turnover rate value (Lambda). (D) Examples of TBP-ERT2 binding and simulated data at the CYP20A1 (solid line) and POLR3E (dashed line) loci. (E) Scatter plot of log2 TBP-ERT2 occupancy versus −log10TBP-ERT2 binding turnover rate. (F) Histogram of the relative frequency of −log10TBP-ERT2 binding turnover rate.


