
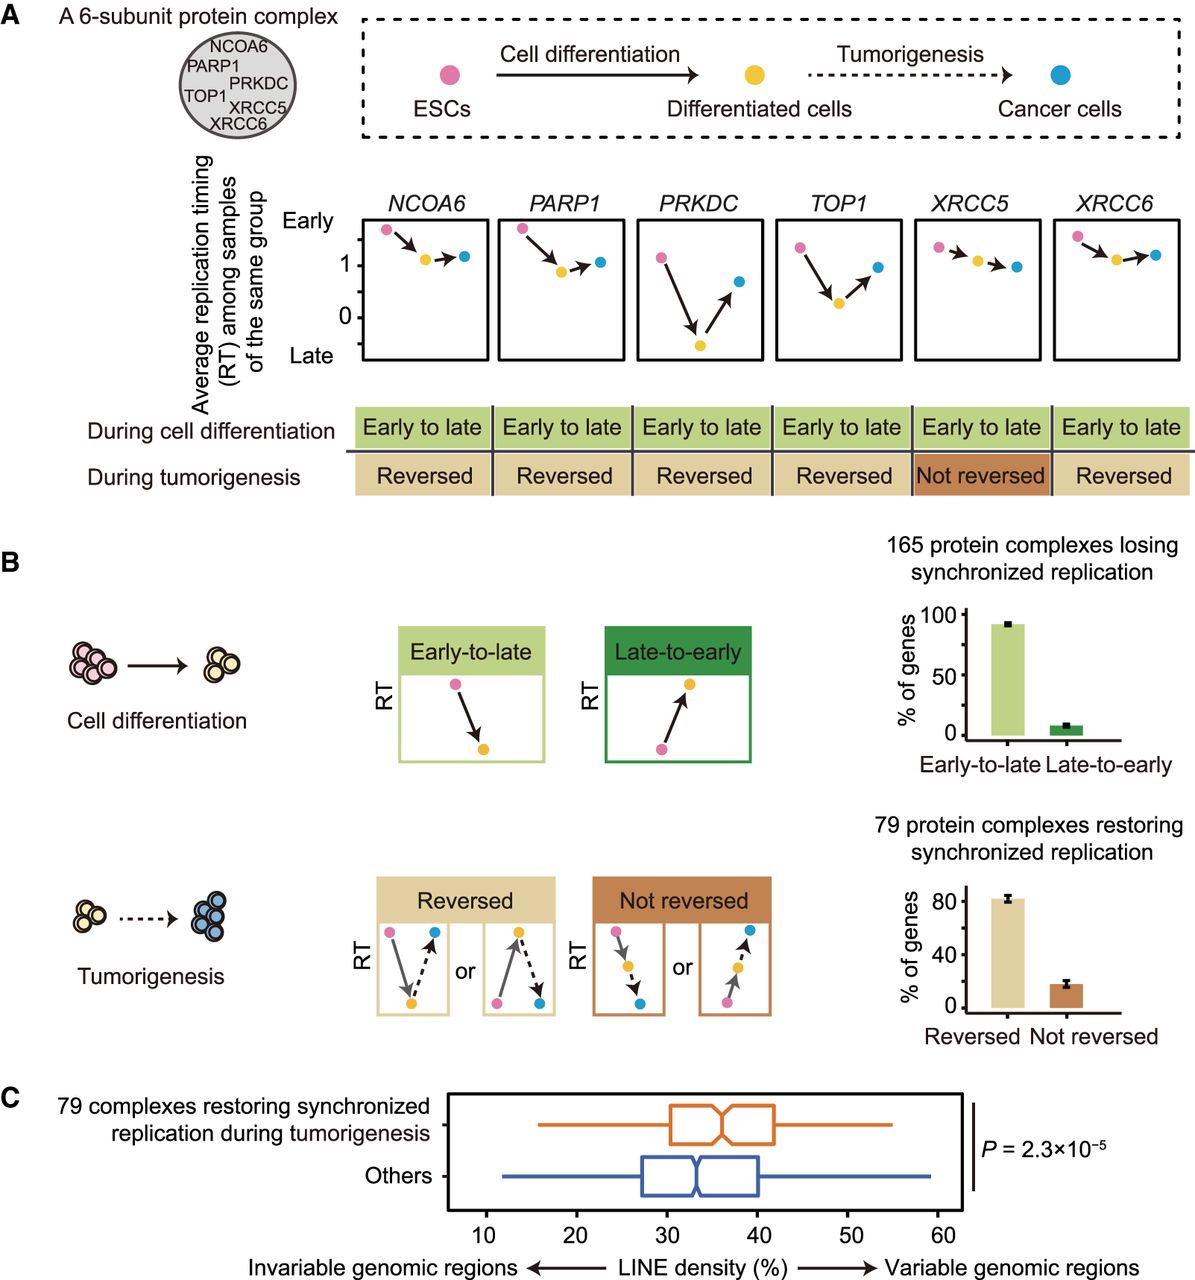
Genes causing changes in synchronized replication reside in the genomic regions with higher LINE density. (A) The average replication timing (RT) among cells in the same group: ESCs, six differentiated cells that do not exhibit synchronized replication (liver and pancreas cells), or cancer cells. A six-subunit protein complex as an example shows the change in replication timing among three groups. (B) Protein complexes losing synchronized replication during cell differentiation or restoring synchronized replication during tumorigenesis were identified. Genes encoding these protein complexes were classified into categories according to the change in replication timing during these two processes. The fraction of genes in each category is shown. Error bars represent the standard deviation estimated from bootstrapping. (C) The comparison of the LINE densities between genes encoding 79 protein complexes that restore synchronized replication during tumorigenesis (orange) and genes encoding other complexes (blue). Outliers are omitted in the box plot.


