
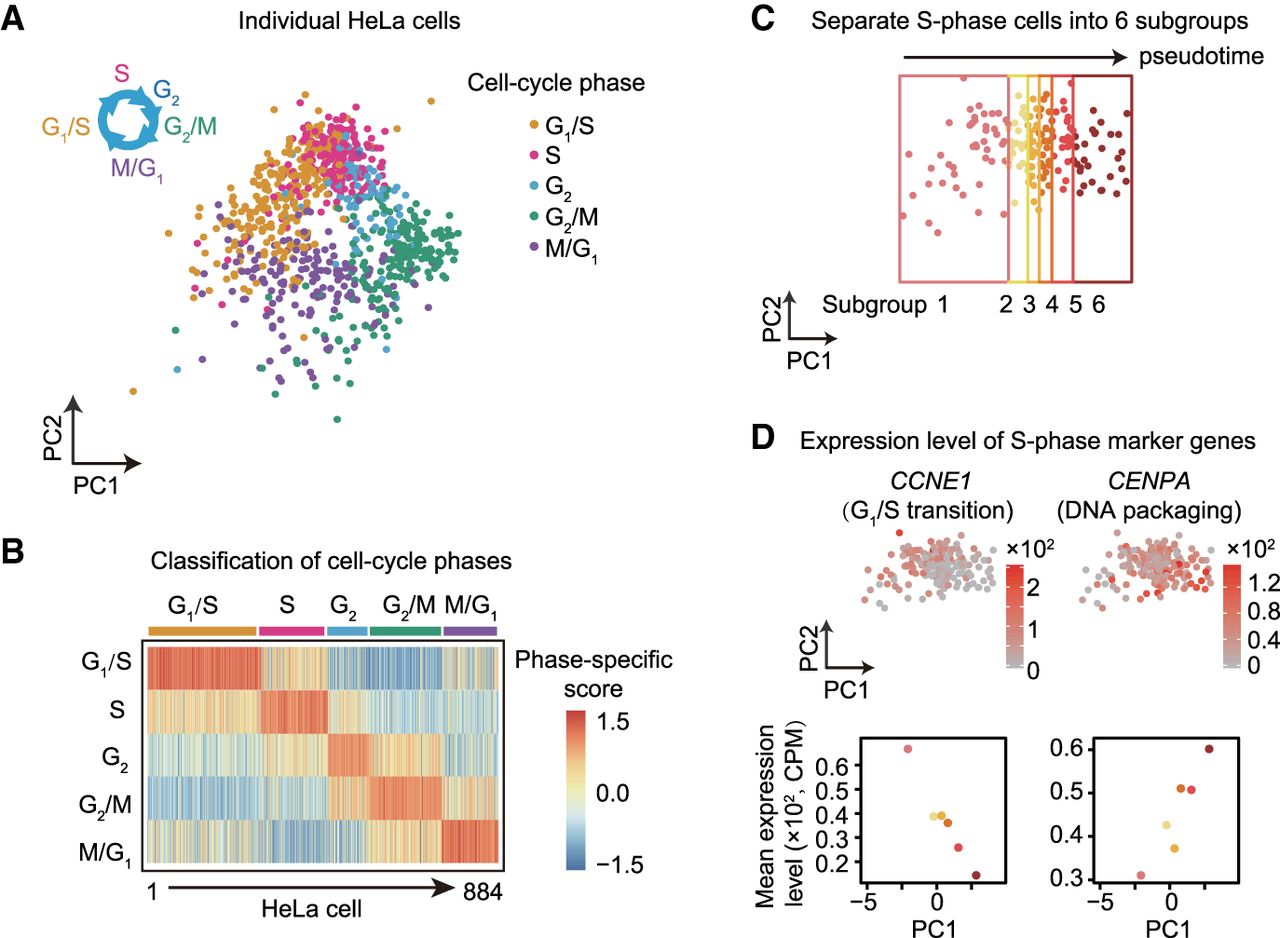
Cell-cycle analysis of the HeLa scRNA-seq data. (A) The PCA plot of 884 individual HeLa cells shows asynchrony in the cell cycle. (B) The cell-cycle status of individual HeLa cells. Each cell is classified into one of the five cell-cycle phases based on the phase-specific scores; 259, 172, 86, 201, and 166 cells were classified into G1/S, S, G2, G2/M, and M/G1 phases, respectively. The phase-specific scores were standardized among five phases for each cell. (C) S-phase cells were separated into six subgroups based on the PC1 values in the PCA plot. Subgroups 1–6 represent the six stages of S phase from early to late. (D) The expression level of S-phase marker genes among cells. CCNE1 (left) and CENPA (right) are known to be highly expressed in the early- and late-S phases, respectively. The average expression level among cells is shown for each S-phase subgroup (bottom).


