
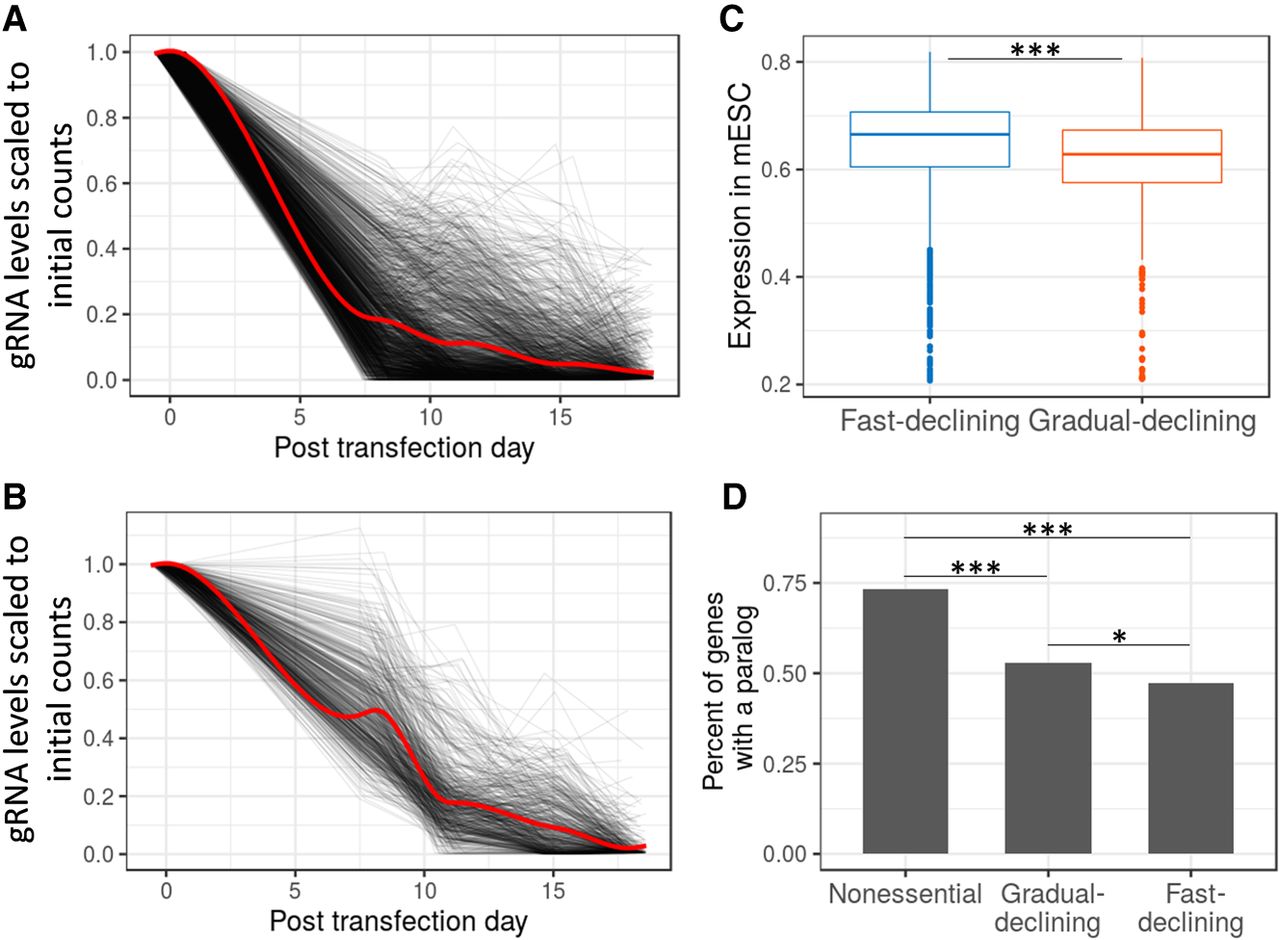
Figure 3.
Gene essentiality as a quantitative phenotype. (A,B) Two different dynamics of gRNA depletion rates (see Supplemental Fig. S3A for clustering results). (A) Fast-declining cluster, and (B) gradual-declining cluster. For each gene the gRNA with the strongest decline is shown (black lines). The red line indicates the trend of all genes in the cluster. (C) Expression in mESCs of genes in the fast- and gradual-declining groups. Expression values are probe signal intensities (log10) from microarray data. (D) Percentage of genes with at least one paralog gene. (*) P < 0.05; (***) P < 0.001.


