
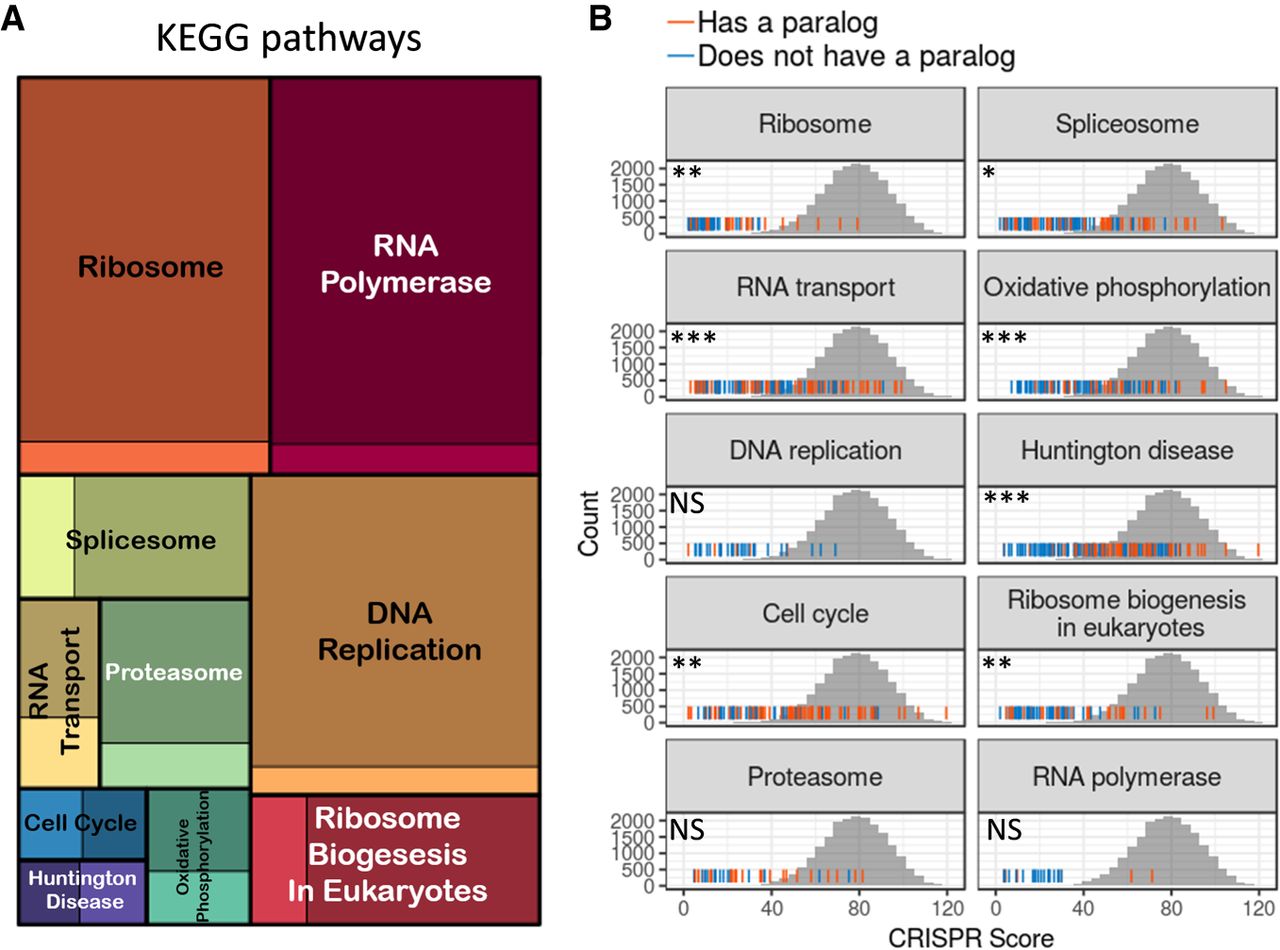
Essential genes belong to basic cellular pathways and tend to lack paralogs. (A) A treemap of the top 10 most enriched KEGG pathways (“essential pathways”). The square size is proportional to the enrichment strength, and the color intensity indicates the proportion of essential (dark color) and nonessential genes (bright colors) in the pathway. (B) For each essential pathway, the rug plot displays the distribution of CRISPR scores (sum of ranks across days) for all genes in the pathway. Orange lines indicate genes with a paralog, and blue lines indicate genes without a paralog. The gray histogram behind is the empirical null distribution of CRISPR scores based on control gRNAs. Significance indicates the differences in scores between genes with and without a paralog. (NS) Nonsignificant, P > 0.05; (*) P < 0.05; (**) P < 0.01; (***) P < 0.001.


