
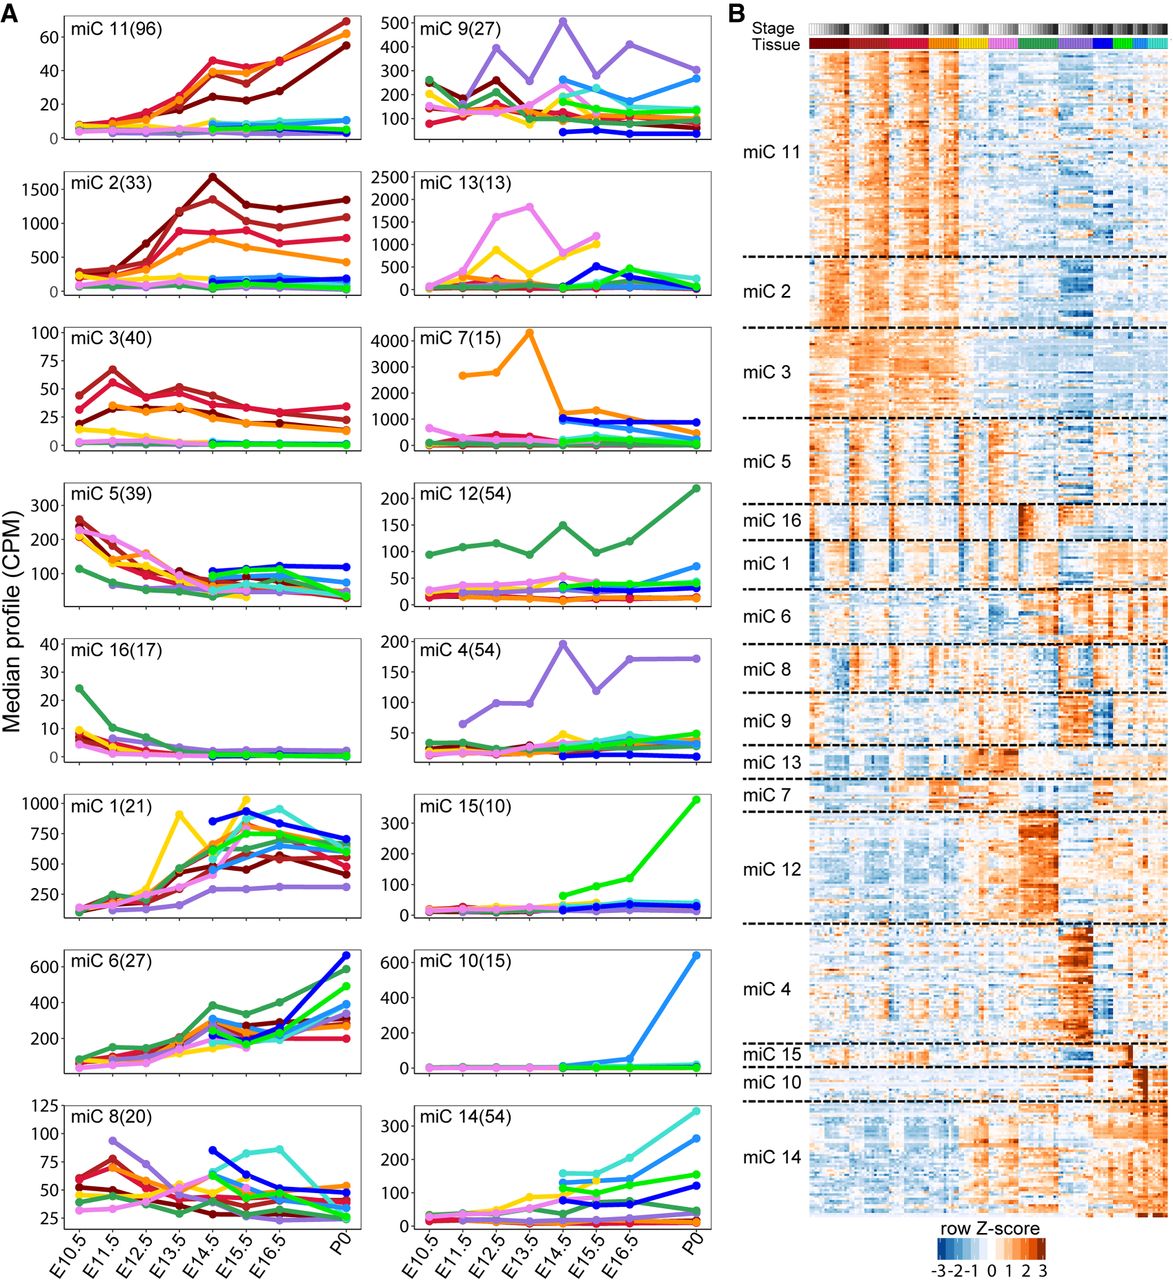
Figure 2.
Clustering of mouse miRNAs during embryonic development time-course. (A) Clustering of miRNAs using maSigPro into 16 nonredundant groups based on median expression level of the miRNAs in each cluster. Organ colors correspond to Figure 1A. (B) Heatmap of the normalized expression levels (z-scores) of miRNAs in each cluster from A. Organ and stage colors correspond to Figure 1A.


