
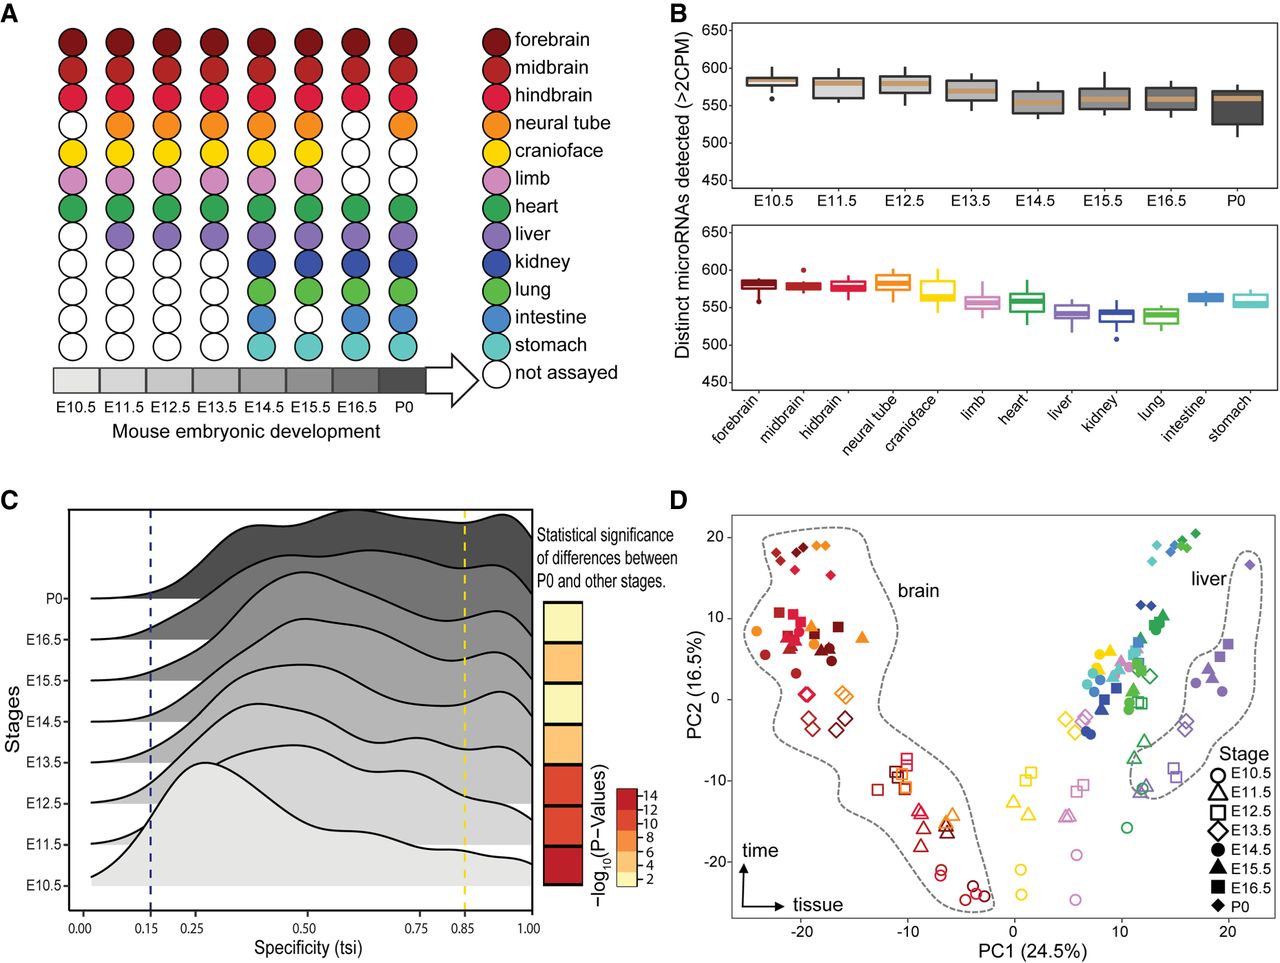
Overview of mouse ENCODE miRNA data sets. (A) Representative major organ systems were profiled in a time-course of mouse embryonic development. (B) Number of distinct miRNAs detected in different organs and developmental stages (minimum two CPM). There are no significant differences between the number of miRNAs detected at different stages or within different organs. Developmental stage and organ colors correspond to A. (C) The distribution of tissue specificity of miRNAs expressed at each developmental stage measured as tissue-specific index (TSI). The miRNAs are significantly more tissue-specific at stage of P0 compared with E10.5 (Kolmogorov–Smirnov [KS] test P-value < 2.2 × 10⁻¹⁶). (D) Principal component analysis (PCA) of 12 mouse organs across eight developmental stages. Organs are represented by various colors corresponding to A, whereas shapes denote the different developmental stages.


