
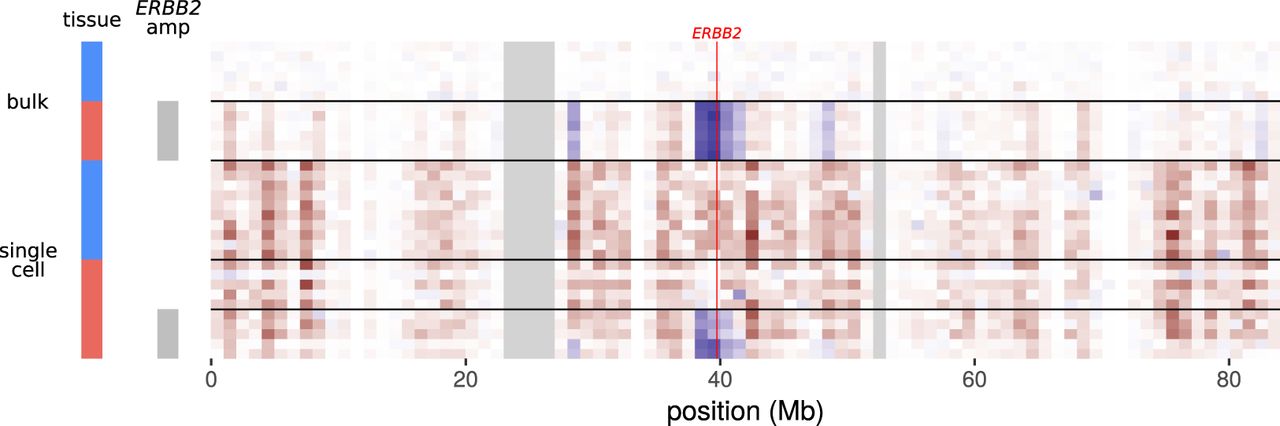
Figure 5.
Inferred DNA copy number for Chromosome 17 in bulk and single-cell samples. Genes are aggregated in blocks of 1 Mb by transcription termination site. Heatmap cells show expression normalized to the mean of the bulk macrophages. (Red) Lower expression than bulk macrophages; (blue) higher expression than bulk macrophages; (gray) no data. The bright red line shows the position of the ERBB2 locus. Legend colors for cell types (left) match Figure 4.


