
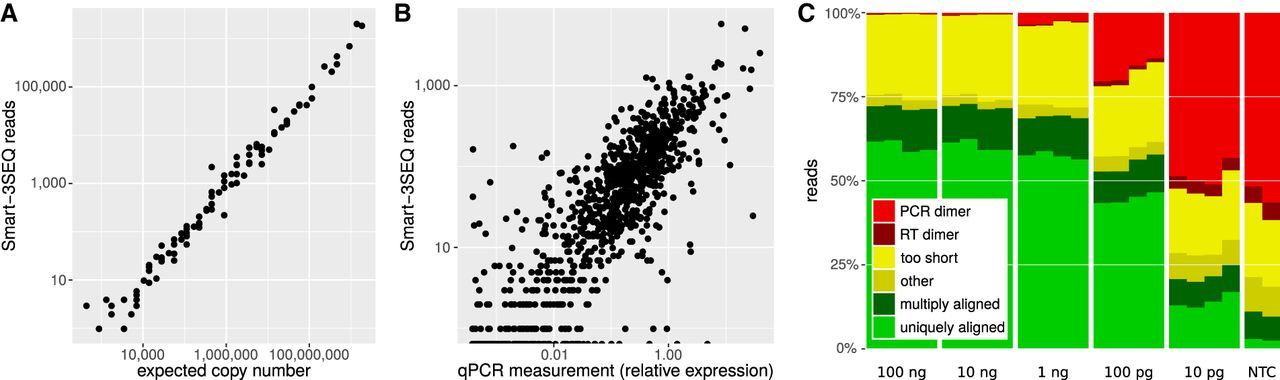
Technical validation of Smart-3SEQ with reference RNAs. (A) Standard curve from ERCC transcripts, r′ = 0.990. Each point represents one transcript sequence; the expected copy number is the estimated number of copies of that transcript in the RNA sample (1 µL at 1/10 dilution, 10 fmol total), and “Smart-3SEQ reads” is the number of postfilter reads aligned uniquely to any part of that transcript's sequence in the expected orientation (6.4 million). Data shown are from the first replicate of the condition with 10 fmol ERCC mix 2 and seven PCR cycles, which had the highest read count for that condition; data from all samples are shown in Supplemental Figure S6. (B) Comparison with TaqMan qPCR quantification of human transcripts, r′ = 0.854. qPCR measurements are normalized to the expression of RNA polymerase II. Data shown are from the first replicate of 100 ng UHRR, which had the highest read count for that amount of input RNA (2.7 million sense-aligned to annotated genes); data from all samples are shown in Supplemental Figure S13. (C) Alignability of Smart-3SEQ reads from human reference RNA dilutions and no-template controls.


