
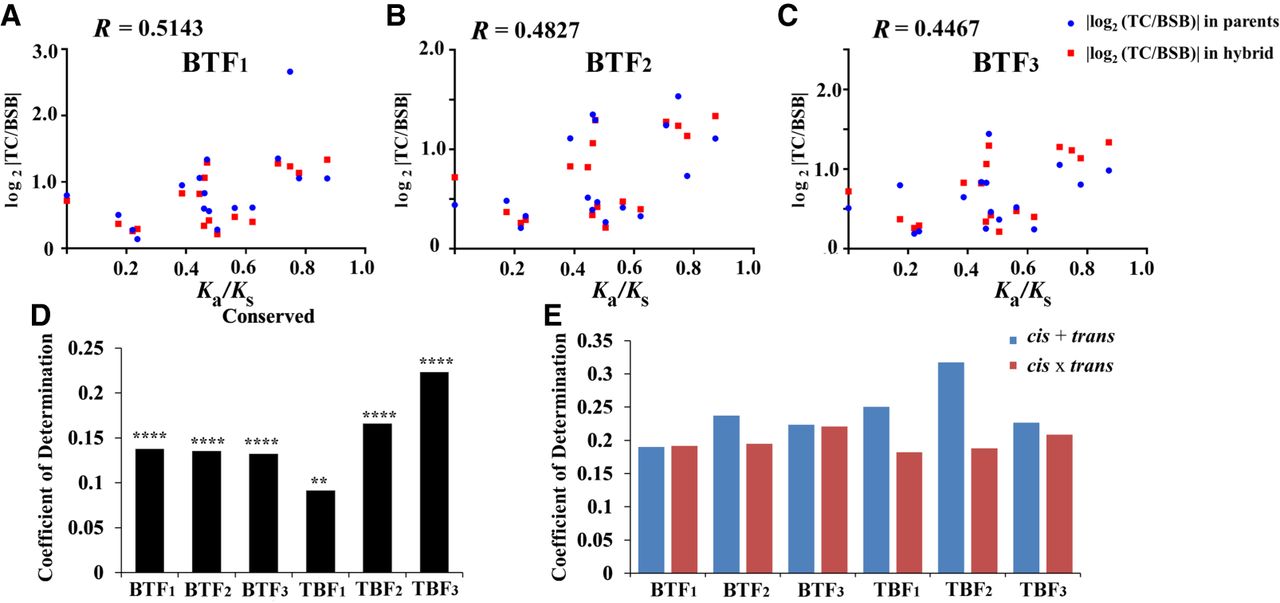
Correlation analyses between evolutionary constraint and expression polymorphism. (A–C) Correlation analyses were performed between Ka/Ks values in parents and relevant log2 |TC/BSB| of parents (red) and hybrids (blue) in cis-regulatory genes (17 shared genes in BT). The correlation coefficient between Ka/Ks values and relevant log2 |TC/BSB| in parents was 0.5635 (P-values < 0.05, Pearson correlation coefficient). The correlation coefficients between Ka/Ks values in parents and relevant log2 |TC/BSB| in hybrids are listed in the graph. (D) The log2 |TC/BSB| values of the parents were determined in conserved genes (1055 in BTF1, 912 in BTF2, 966 in BTF3, 1194 in TBF1, 1045 in TBF2, and 803 in TBF3). (****) P < 0.0001 for Spearman's rank correlation coefficient; (**) P < 0.001. (E) The log2 |TC/BSB| values of the hybrids were determined in “cis + trans” (from 565 to 1488 genes in all samples) and “cis × trans” genes (from 643 to 1504 genes in all samples) (all P < 0.0001, Spearman's rank correlation coefficient).


