
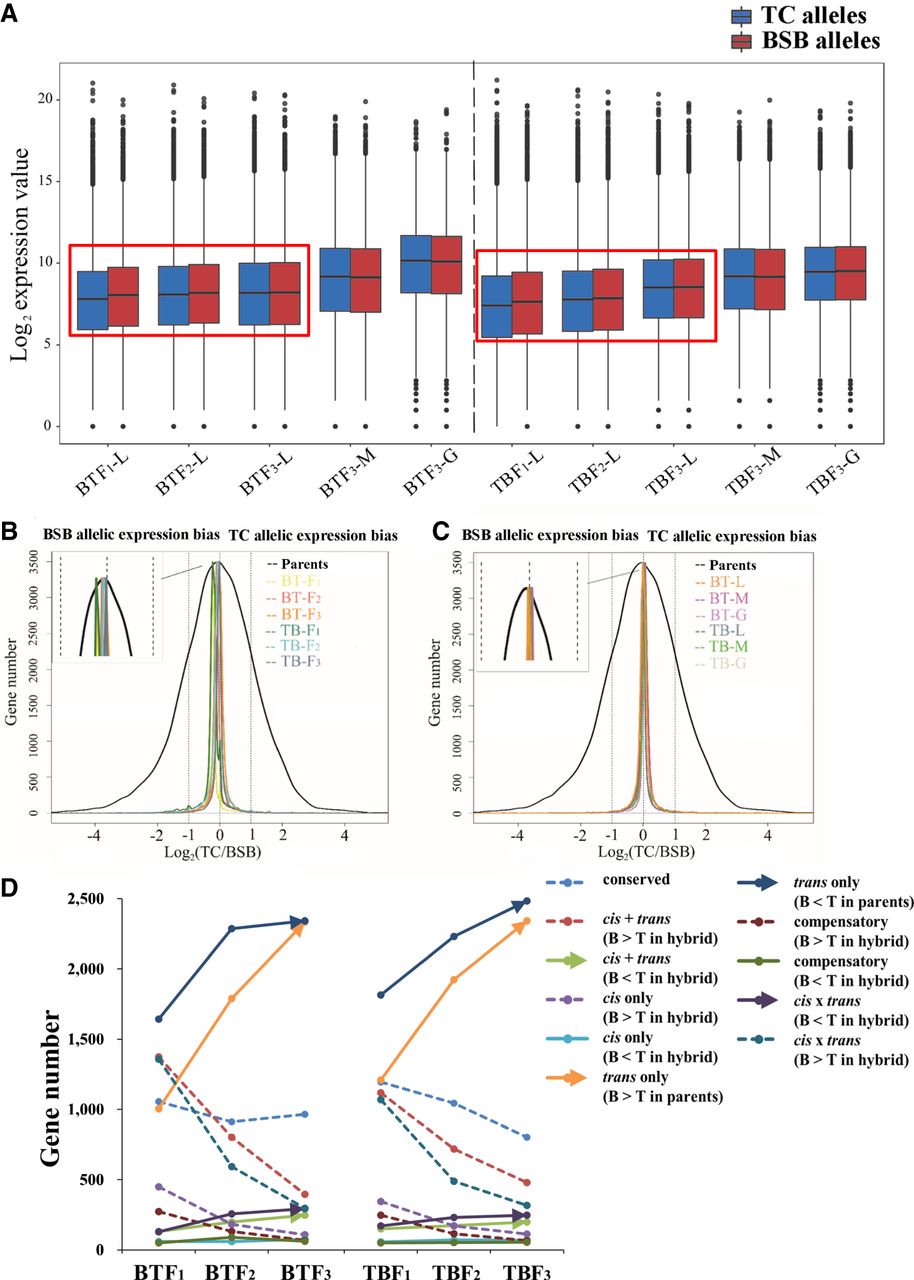
Figure 4.
Allelic expression and cis- and trans-regulation in hybrids. (A) BSB and TC allelic expression values were observed in BT and TB. The black line in the box represents the median value. (B,C) The density distribution of log2(TC/BSB) values was determined in the parents and their hybrid offspring. This graph depicts the extent of allelic expression bias in three tissues: (L) liver; (G) gonad; (M) muscle. (D) Cis- and trans-regulation were observed in the livers of BT and TB. The arrows and the dotted lines represent gradual increasing and decreasing trends in gene number, respectively, from F1 to F3. The solid line represents the absence of an obvious trend.


