
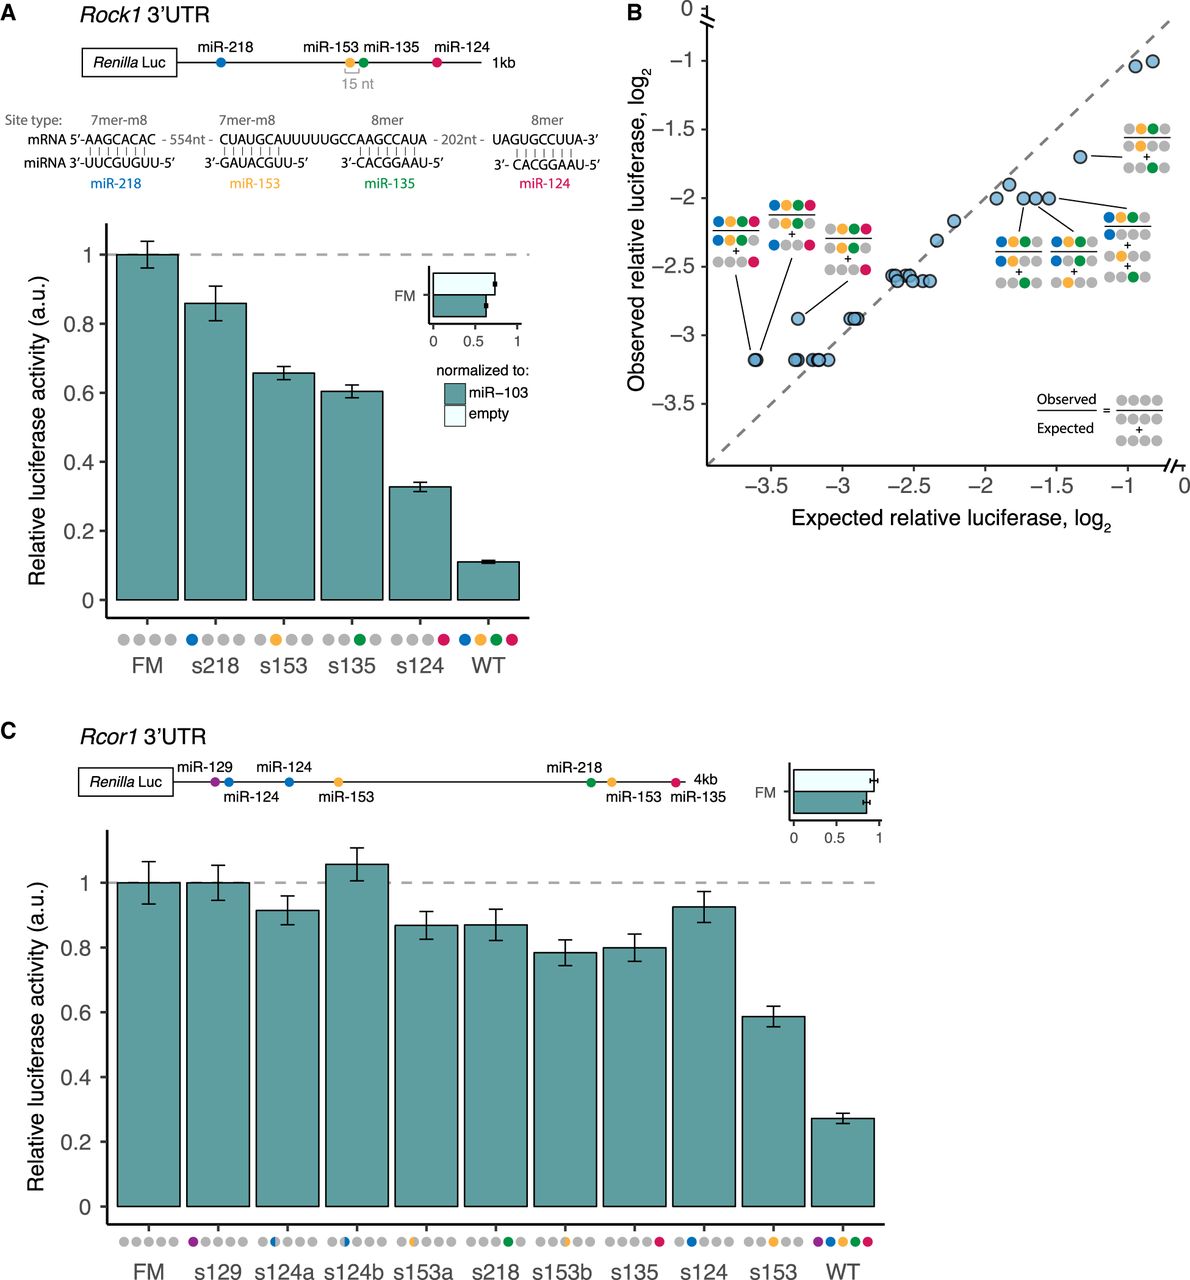
Figure 6.
Strong and complex patterns of repression of Rock1 and Rcor1 3′ UTRs by brain cluster miRNAs. (A) Rock1 3′ UTR cloned downstream from Renilla luciferase, as in Figure 5. (B) Observed/expected relative luciferase (log2) for all combinations of sites that were significant relative to empty vector or miR-103 controls is shown. (C) Rcor1 3′ UTR cloned downstream from Renilla luciferase, as in B. Colored semicircles indicate first (left semicircle) or second (right semicircle) miR-124 and miR-153 sites in UTR. See also Supplemental Figure S6.


