
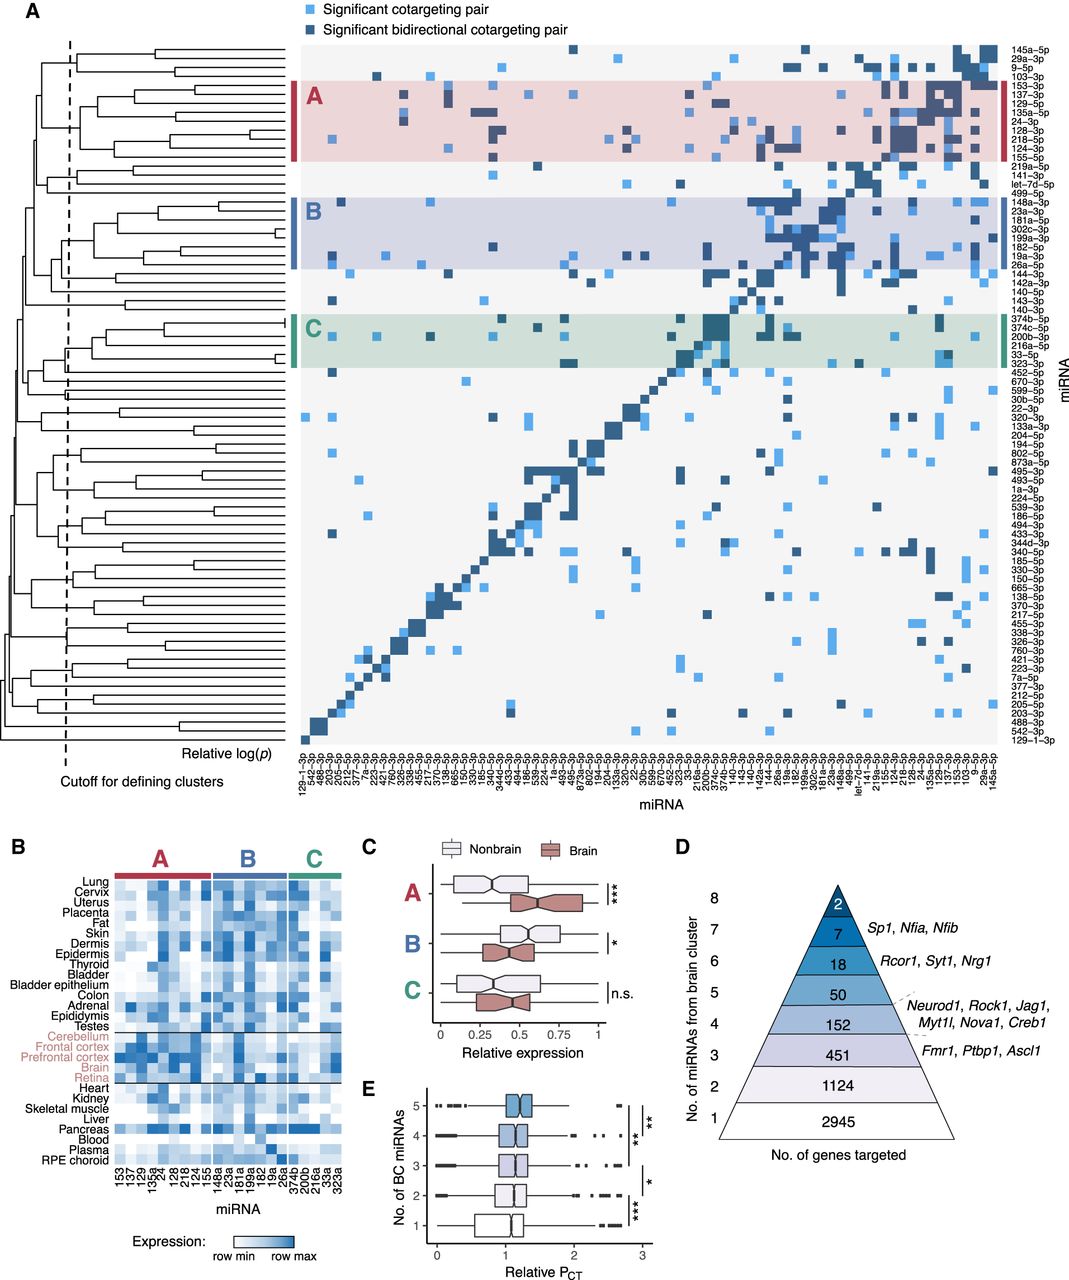
Patterns of cotargeting among pairs and groups of miRNAs. (A) Pairwise cotargeting relationships for 78 conserved miRNA families, showing unidirectional (light blue) and bidirectional (dark blue) significant cotargeting relationships with the reference miRNA on the y-axis (both with q-val < 0.05), and nonsignificant relationships (light gray). Rows were clustered using average linkage hierarchical clustering with distances defined as M − avg(−log10[pval]) from a binomial test of the extent of overlap of significant cotargeting relationships between rows, where M is the maximum −log(pval) observed. Vertical dotted line indicates cutoff distance (=2.8) at which clusters of five or more miRNAs were defined. Clusters are highlighted with red (cluster A), blue (cluster B), or green (cluster C). (B) Heatmap of miRNA expression clustering across human tissues (brain tissues labeled in pink). Samples are normalized to the maximum and minimum values in each row, and relative expression is expressed as (sample – min)/(max – min). (C) Box plots show relative expression of each miRNA in each cluster in brain tissues versus nonbrain tissues, grouped as in B; (*) significance by Kolmogorov–Smirnov test. (D) The number of genes predicted as targets of different numbers of miRNAs from the brain cluster, with selected genes listed at right. (E) Relative PCT scores (normalized to the transcriptome-wide mean PCT of sites for each miRNA) for miRNA sites in genes targeted by different numbers of brain cluster miRNAs. Wilcoxon rank-sum test: (*) P < 0.05, (**) P < 0.01, (***) P < 0.001. See also Supplemental Figure S4.


