
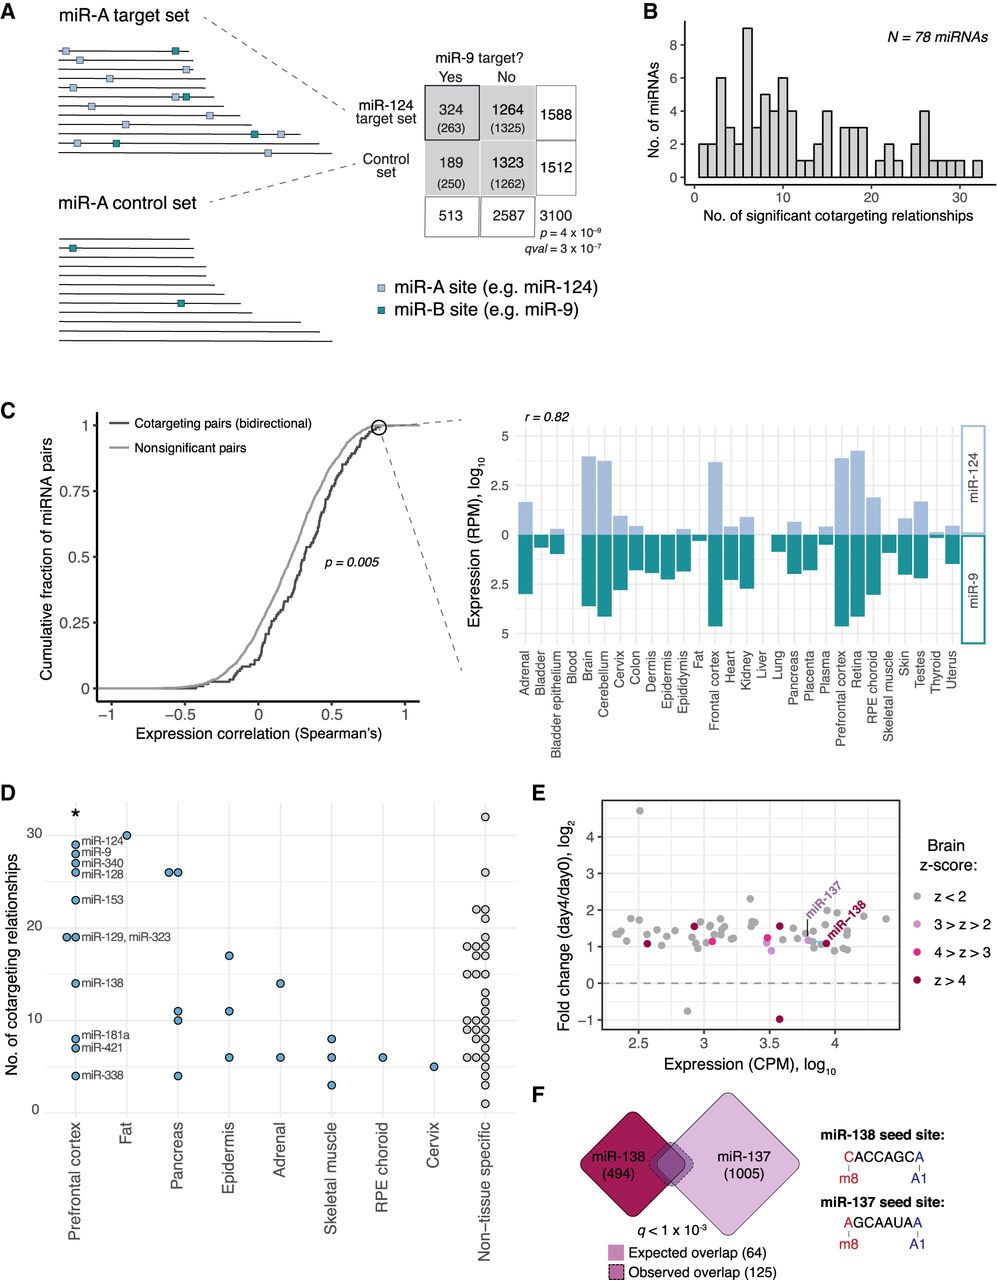
Cotargeting by distinct miRNA pairs is prevalent, particularly among brain-specific miRNAs. (A) Our statistical test for cotargeting between a pair of miRNAs is illustrated. Control sets are made for the reference miRNA (miR-A) that match the distribution of 3′ UTR length, C + G content, and sequence conservation of miR-A's TargetScan 7-mer and 8mer targets. The number of conserved 7-mer and 8mer sites for a second miRNA (miR-B; teal boxes) in miR-A targets (miR-A sites marked by light blue boxes) and in miR-A's control set are counted, and significance is determined by chi-square test. Target set overlaps are shown in a contingency table (expected values in parentheses) for miR-9 compared with miR-124 and its control set. (B) The tally of miRNAs with given numbers of significant cotargeting relationships (with qval < 0.05). (C) Cumulative distributions of Spearman's correlation of miRNA expression across a set of 28 human tissues for bidirectional cotargeting pairs (dark gray) or nonsignificant pairs (light gray; P = 5 × 10⁻³, Kolmogorov-Smirnov test). Correlation of expression of miR-124 and miR-9 across human tissues (Spearman's ρ = 0.82). (D) Number of cotargeting relationships for strongly tissue-specific miRNAs, grouped by tissue of strongest enrichment, for tissues with one or more assigned miRNA. (*) P < 0.05 (Wilcoxon rank-sum test), compared with non-tissue-specific miRNAs or miRNAs specific to other tissues. (E) Fold change in expression (normalized counts per million [CPM]) of significantly changing miRNAs in CAD cell differentiation after serum withdrawal. Circles colored by prefrontal cortex Z-score. Blue line connects bidirectional cotargeting pairs among the brain-enriched miRNAs. (F) Overlap of miR-138 (red) and miR-137 (purple) predicted target sets. Dashed line shows the observed overlap relative to the expected overlap (solid line). The q-value shown is the geometric mean of the q-values from the miR-138 → miR-137 and miR-137 → miR-138 comparisons. Seed sequences for each miRNA are shown at right. See also Supplemental Figure S1 and Supplemental Table S1.


