
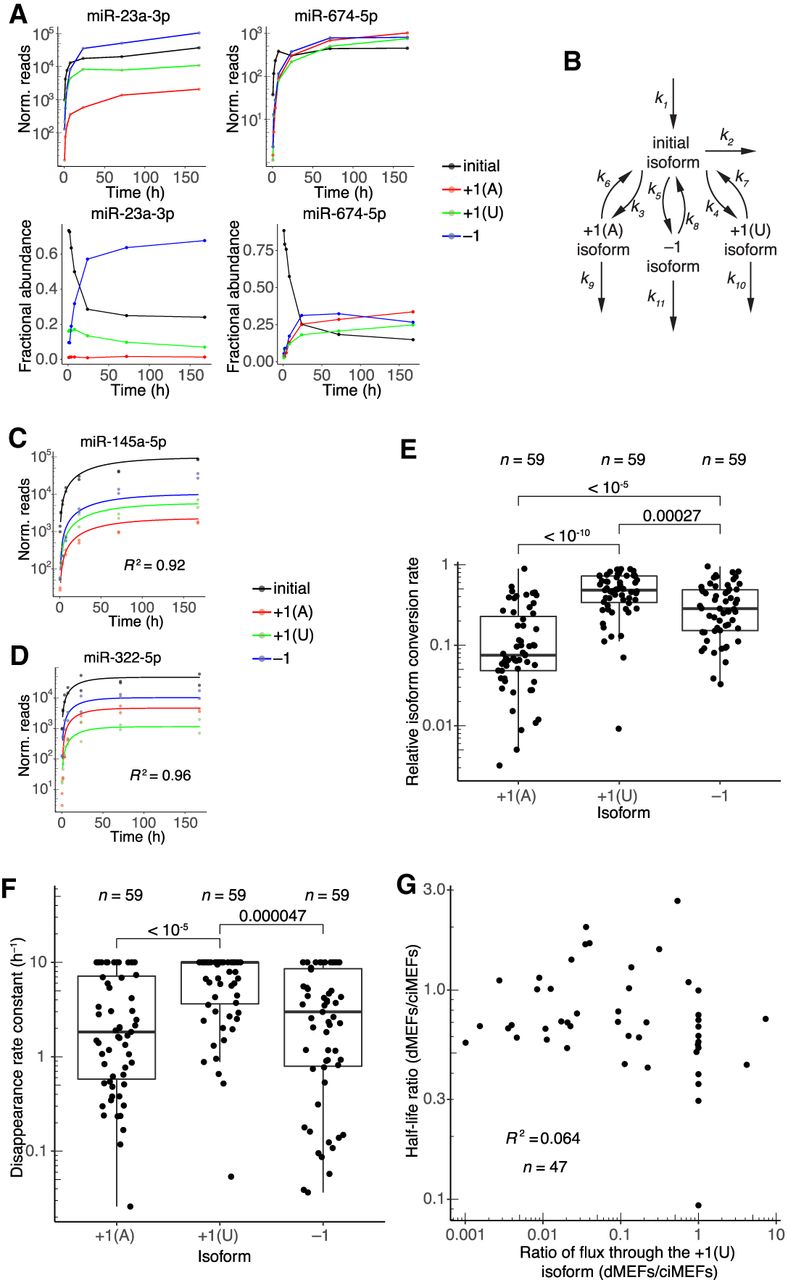
Dynamics of 3′-end isoforms. (A) Isoform accumulation for miR-23a-3p and miR-674-5p, two guide RNAs for which accumulation of derivatives of the initial isoform overtook that of the initial isoform. (Top) Absolute accumulation of the initial isoform (black) and its major derivatives, in which it is either trimmed by 1 nt (−1, blue) or tailed with either a single A (+1[A], red) or a single U (+1[U], green). Lines connect the mean values for each time point and do not represent fits to the data. (Bottom) Fractional abundance of the initial isoform and its major derivatives. (B) Schematic depicting the isoform-conversion model that was fit to the data and used for simulations. Arrows represent processes catalyzed by the cellular milieu of nucleotidyl transferases, phosphodiesterases, and other enzymes; the model is agnostic to the particular enzyme that carries out each reaction. Rate constants extracted from the fit are labeled (kn). Isoform nomenclature is as in A. (C,D) Representative examples of fits to isoform dynamics for miRNAs in contact-inhibited MEFs. Shown is the plot from the middle of the lowest quartile (miR-145a-5p, R2 = 0.92) and the plot from the middle of the highest quartile (miR-322-5p, R2 = 0.96) of goodness-of-fit (R2), when fitting data from both replicates. (E) Relative rates of conversion to the +1(A), +1(U), and −1 isoforms in contact-inhibited MEFs. Rate constants of conversion to each isoform (k3, k4, and k5 for +1(A), +1(U), and −1, respectively) were normalized to the summed conversion rate constant (k3 + k4 + k5) to generate the relative rates of conversion. Simulations indicated that conversion rate constants >1 h−1 could not be accurately fit, and thus conversion rate constants were capped at this value. Significance was evaluated with a Mann–Whitney U test, and P values are shown. (F) Rate constants for disappearance (k6 + k9, k7 + k10, or k8 + k11) of the +1(A), +1(U), and −1 isoforms, respectively, in contact-inhibited MEFs. Simulations indicated that disappearance rate constants >10 h−1 could not be accurately fit, and thus disappearance rate constants were capped at this value. Significance was evaluated with a Mann–Whitney U test, and all significant comparisons are indicated together with their P values. (G) Correlation between half-life ratios (dividing values from dividing MEFs by those from contact-inhibited MEFs) and ratios of the flux through the +1(U) isoform (again dividing values from dividing MEFs by those from contact-inhibited MEFs). Dividing MEFs are denoted as dMEFs; contact-inhibited MEFs are denoted as ciMEFs.


