
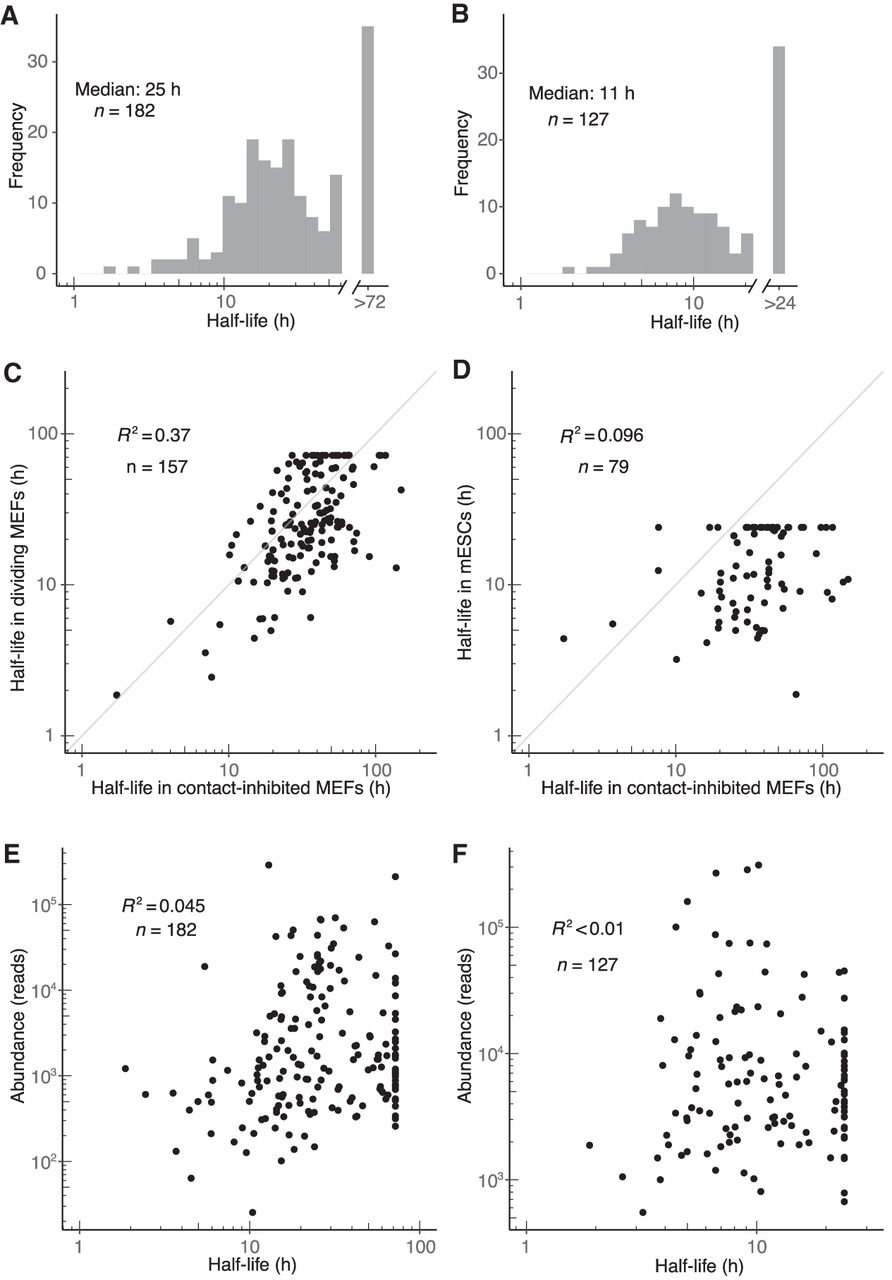
Figure 5.
Dynamics of miRNA guide strands in dividing MEFs and mESCs. (A,B) Half-life distributions for guide strands in dividing MEFs (A) and mESCs (B). Half-lives were capped at the duration of the longest time interval (72 h and 24 h in dividing MEFs and mESCs, respectively), as modeling indicated that longer half-lives would be fit less accurately. (C,D) Guide-strand half-lives in dividing MEFs (C) and mESCs (D) as a function of those half-lives in contact-inhibited MEFs. (E,F) Relationship between steady-state abundance and half-life in dividing MEFs (E) and mESCs (F). Steady-state abundance is measured as reads in the 72- and 24-h input sample, respectively.


