
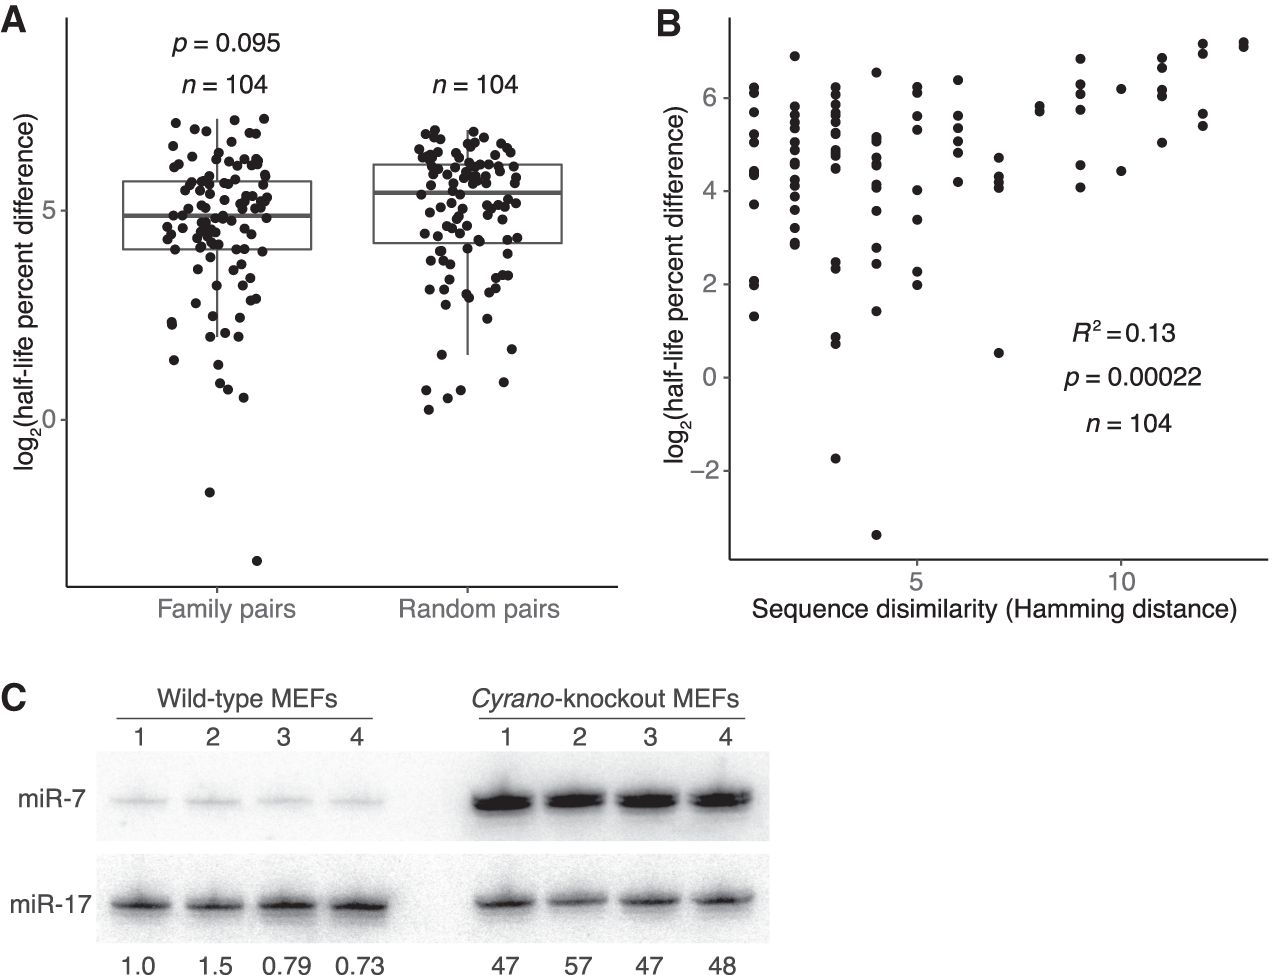
Features associated with rapid miRNA turnover. (A) Differences in half-life for pairs of family members or randomly paired guides. For each pair-wise comparison of all members within each miRNA family, half-life percent differences were computed as the absolute value of the difference between half-lives, divided by the mean of the two half-lives, with this fraction then multiplied by 100. The log2-transformed percent-difference values of all such comparisons in contact-inhibited MEFs are plotted (box, quartiles; whiskers, at most 1.5 times the inter-quartile range). Twenty-five equally sized cohorts of randomly paired guides were analyzed in the same way, with the cohort shown for comparison being the one with the median value of significance (P value, two-sample t-test). (B) Relationship between half-life difference and the number of nonidentical nucleotides (Hamming distance) when comparing pairs of family members. Only nucleotides 3′ of the seed region were considered for the Hamming-distance measurement. Greater Hamming distances represent more dissimilar sequences. Significance of the correlation was determined by a t-test. (C) The effect of Cyrano on steady-state miR-7 levels in contact-inhibited MEFs. Shown is a scan of a northern blot analyzing RNA from wild-type and Cyrano-knockout contact-inhibited MEFs. For each cell line, four biological replicates were analyzed, sequentially probing for miR-17, which served as a loading control, and then for miR-7. The fold-difference in miR-7 relative to the average miR-7 level in wild-type MEFs is shown below each lane.


