
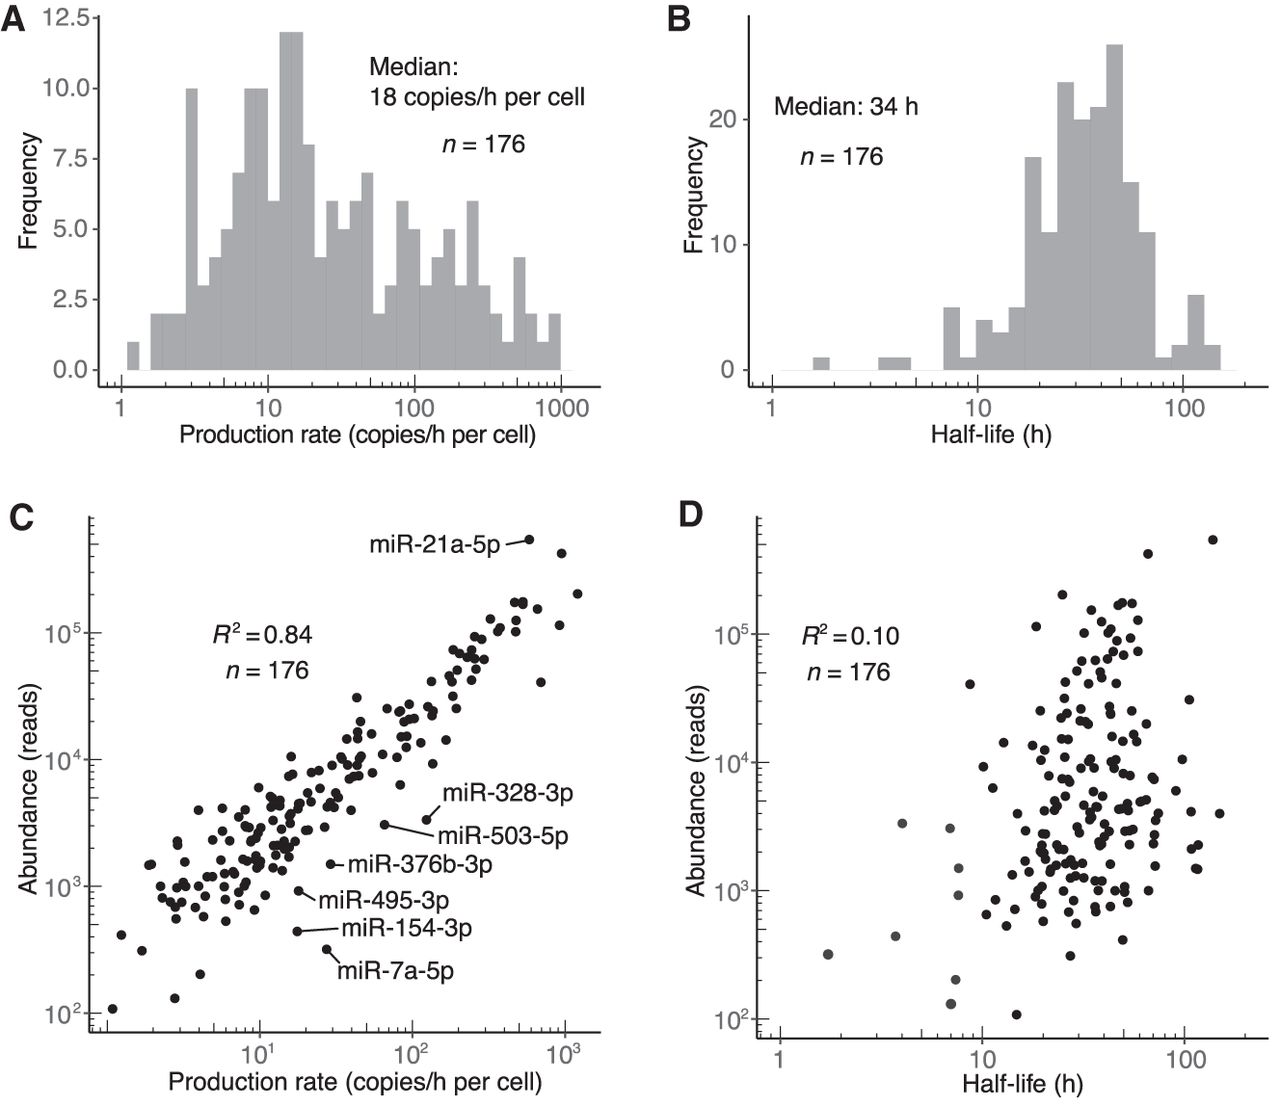
Dynamics of miRNA guide strands in contact-inhibited MEFs. (A) Distribution of production rates for guide strands in contact-inhibited MEFs. (B) Distribution of half-life values for guide strands in contact-inhibited MEFs. (C) Relationship between steady-state abundance (reads in the 1-wk input sample) and production rate of guide strands in contact-inhibited MEFs. Outliers that passed an expression threshold (production rate >5 copies/h/cell) and differed significantly from the best linear fit (|z-score| > 2) are labeled. (D) Relationship between steady-state abundance (reads in the 1-wk input sample) and half-life of guide strands in contact-inhibited MEFs. The eight most rapidly turned over miRNAs, in order from least to most stable, were miR-7a-5p, miR-154-3p, miR-328-3p, miR-503-5p, miR-450b-5p, miR-329-5p, miR-495-3p, and miR-376b-3p.


