
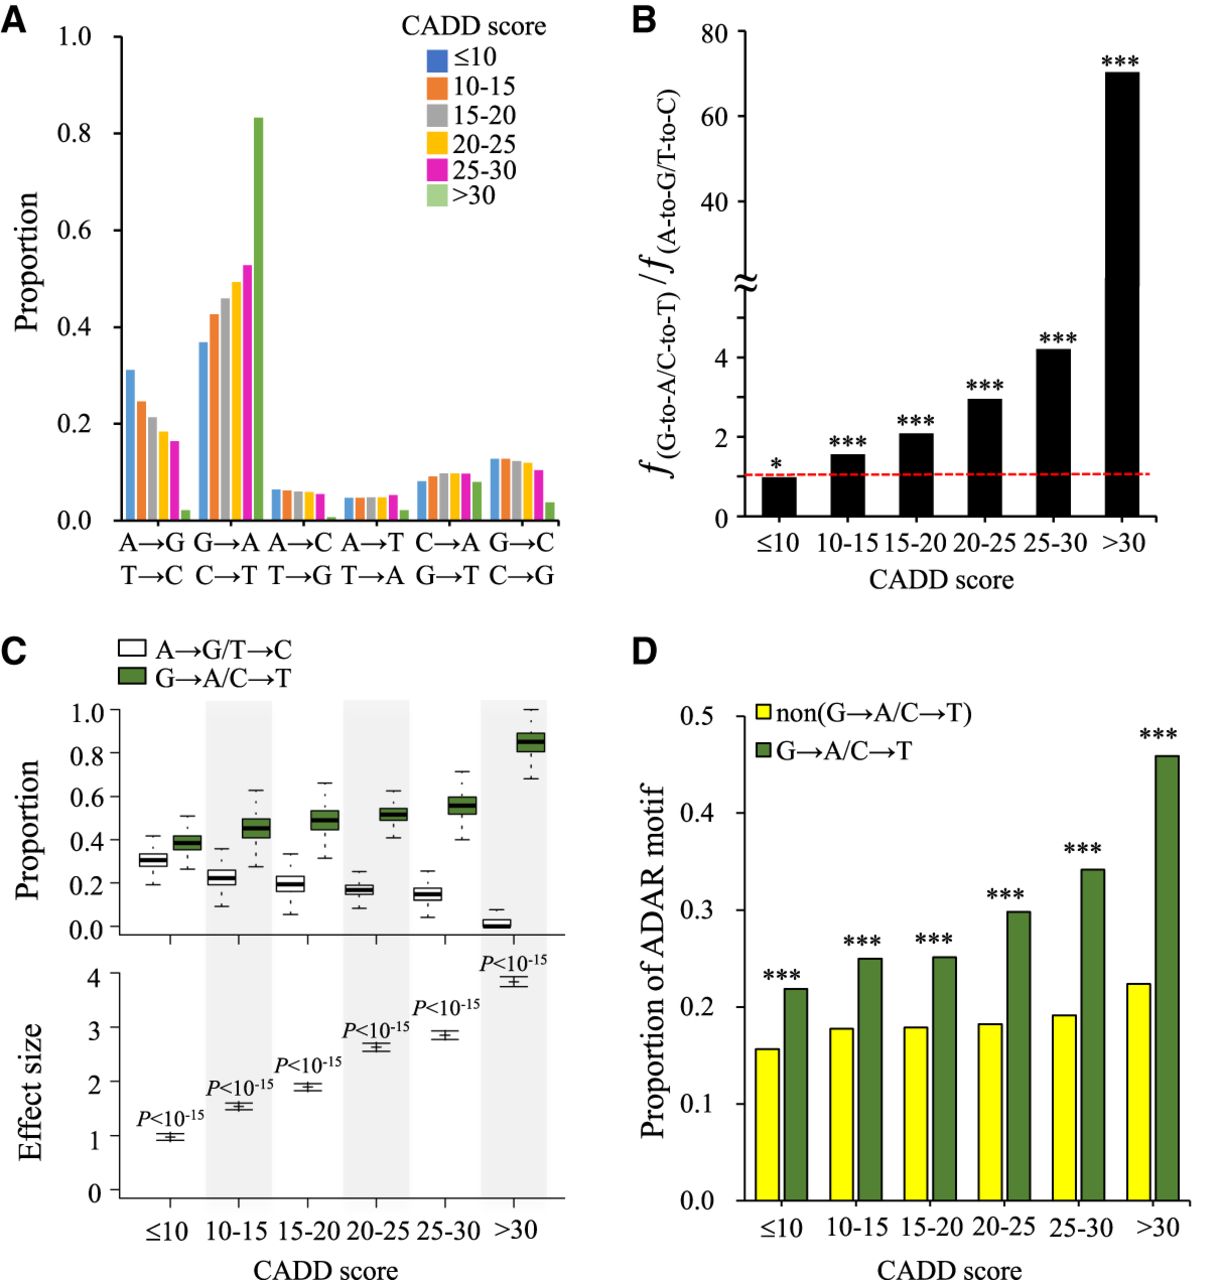
Relationship between the distributions of different types of rare missense mutations and A-to-G RNA editing. (A) Correlation between the distributions of different types of rare missense mutations from the 1000 Genomes Project and deleteriousness (measured by CADD scores) of the corresponding genomic changes. (B) Fraction of the frequency of nonsynonymous G-to-A/C-to-T changes to the frequency of nonsynonymous A-to-G/T-to-C changes (i.e., the ƒ(G-to-A/C-to-T)/ƒ(A-to-G/T-to-C) ratio) for different deleterious effects of the genomic changes. (C) Comparisons of the individual mutational burden of the two types of rare transition missense mutations (A-to-G/T-to-C and G-to-A/C-to-T) in the 1000 Genomes Project. The top panel represents the proportions of rare A-to-G/T-to-C and G-to-A/C-to-T missense mutations per individual for different CADD scores. The bottom panel represents the differences (effect sizes) in mutational burden between these two types of rare missense variants. Effect sizes were measured by Cohen's d, which was defined as the difference between both mean numbers of these two types of rare missense mutations divided by the standard deviation of the paired differences. The estimated 95% confidence intervals of effect sizes were plotted (see also Supplemental Table S3). (D) Comparisons of the proportions of SNP sites with the ADAR motif for different deleterious effects of G-to-A/C-to-T and non-G-to-A/C-to-T rare missense mutations. P-values were determined using a two-tailed Fisher's exact test (B and D) or a two-tailed Wilcoxon signed-rank test (C). (*) P-value < 0.05, (***) P-value < 0.001.


