
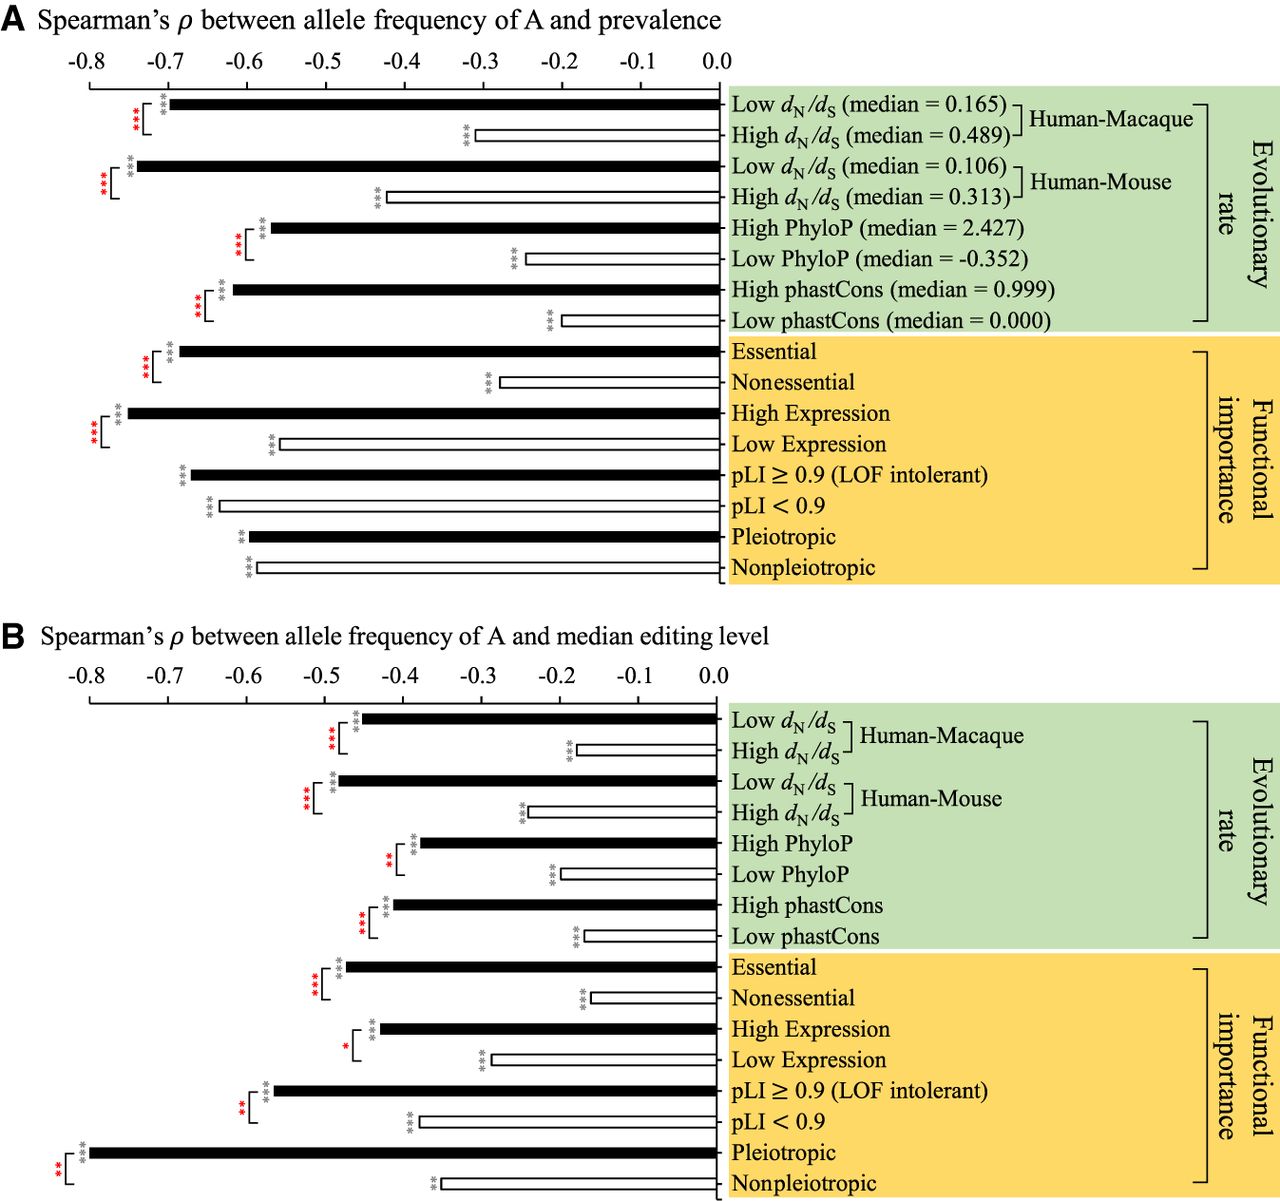
Functional and evolutionary analysis of the RNA editing-allele frequency correlations. The histograms represent the correlations between nonsynonymous editing activities ([A] prevalence and [B] median editing level) and allele A frequency within the LCL population in four categories of evolutionary rates and four categories of functional importance (see the text) of the target genes/loci where the editing sites were located. For the four categories of evolutionary rates, editing sites were divided into two equal groups according to the high and low scores of the target genes/loci. The statistical significance of Spearman's rank correlation coefficients (ρ) are represented by black stars. Significant differences between two independent correlations (represented by red stars) were estimated using a two-tailed Z-score test with the paired.r function within the psych R library. (*) P-value < 0.05, (**) P value < 0.01, (***) P-value < 0.001.


