
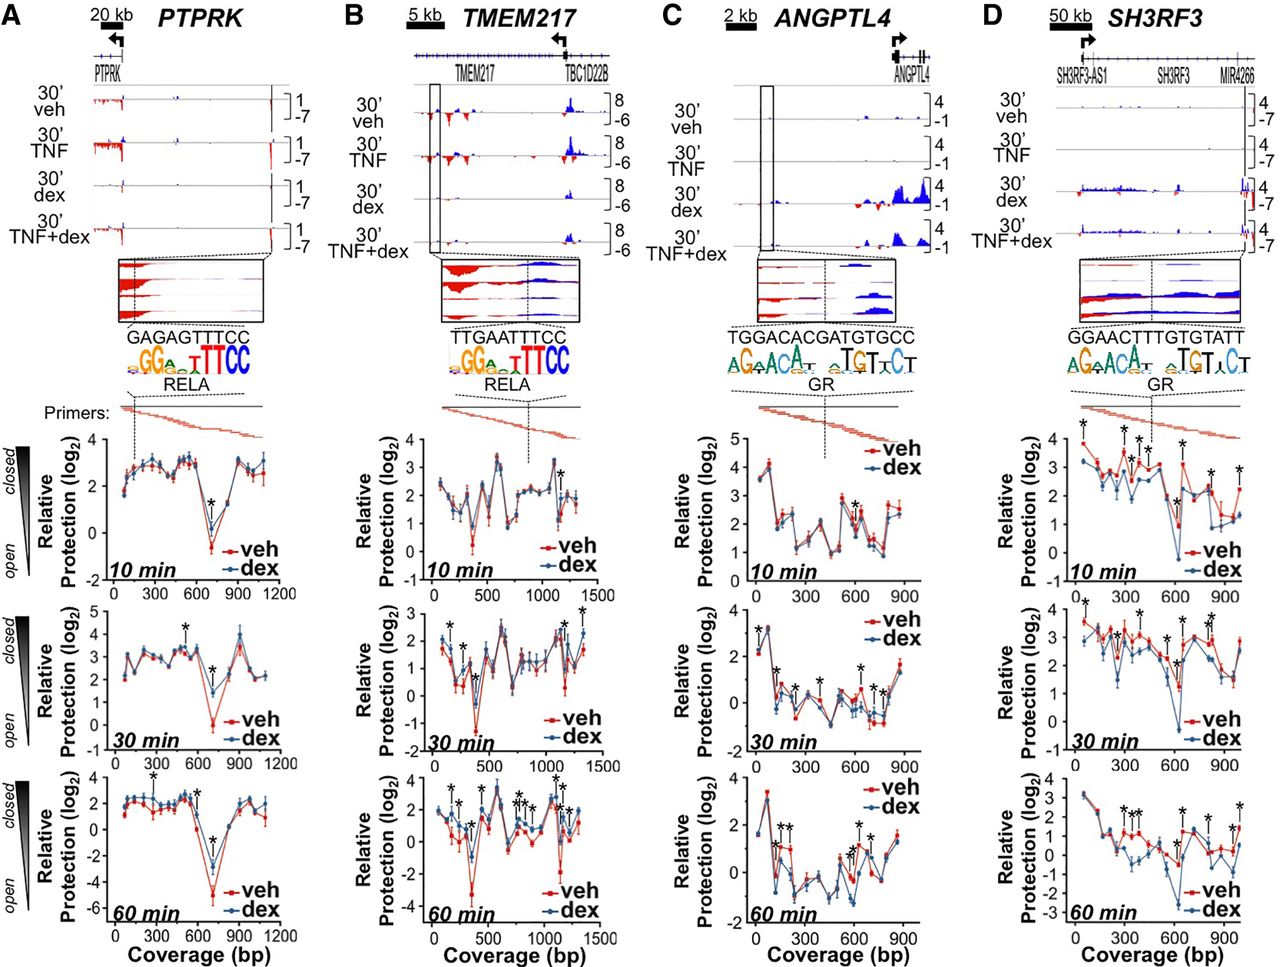
Dex treatment rapidly changes basal chromatin structure of both TNF- and dex-induced enhancers. (A–D, top) IGV screenshots of GRO-seq data with solid black lines/rectangles showing specific TNF-induced (A,B) and dex-induced (C,D) enhancer regions that were interrogated by the MNase assay. Below each screenshot is a zoomed-in view of each assayed region, including the location (dotted black line) and sequence of the strongest match to the NFKB(1,2)/RELA consensus binding motif (A,B) and GR binding motif (C,D). Beneath the binding site matches are the locations of overlapping tiled qPCR primers (amplicons in red) that span each region and correspond to the data points in the line graphs below. (A–D, bottom) Mean relative protection (±SD) against MNase cleavage of each target region as measured by qPCR in BEAS-2B cells treated with veh or dex for 10, 30, or 60 min. (*) P < 0.05 versus veh with Bonferroni correction. Greater protection indicates less accessibility or a more closed chromatin structure, as illustrated on the far left.


