
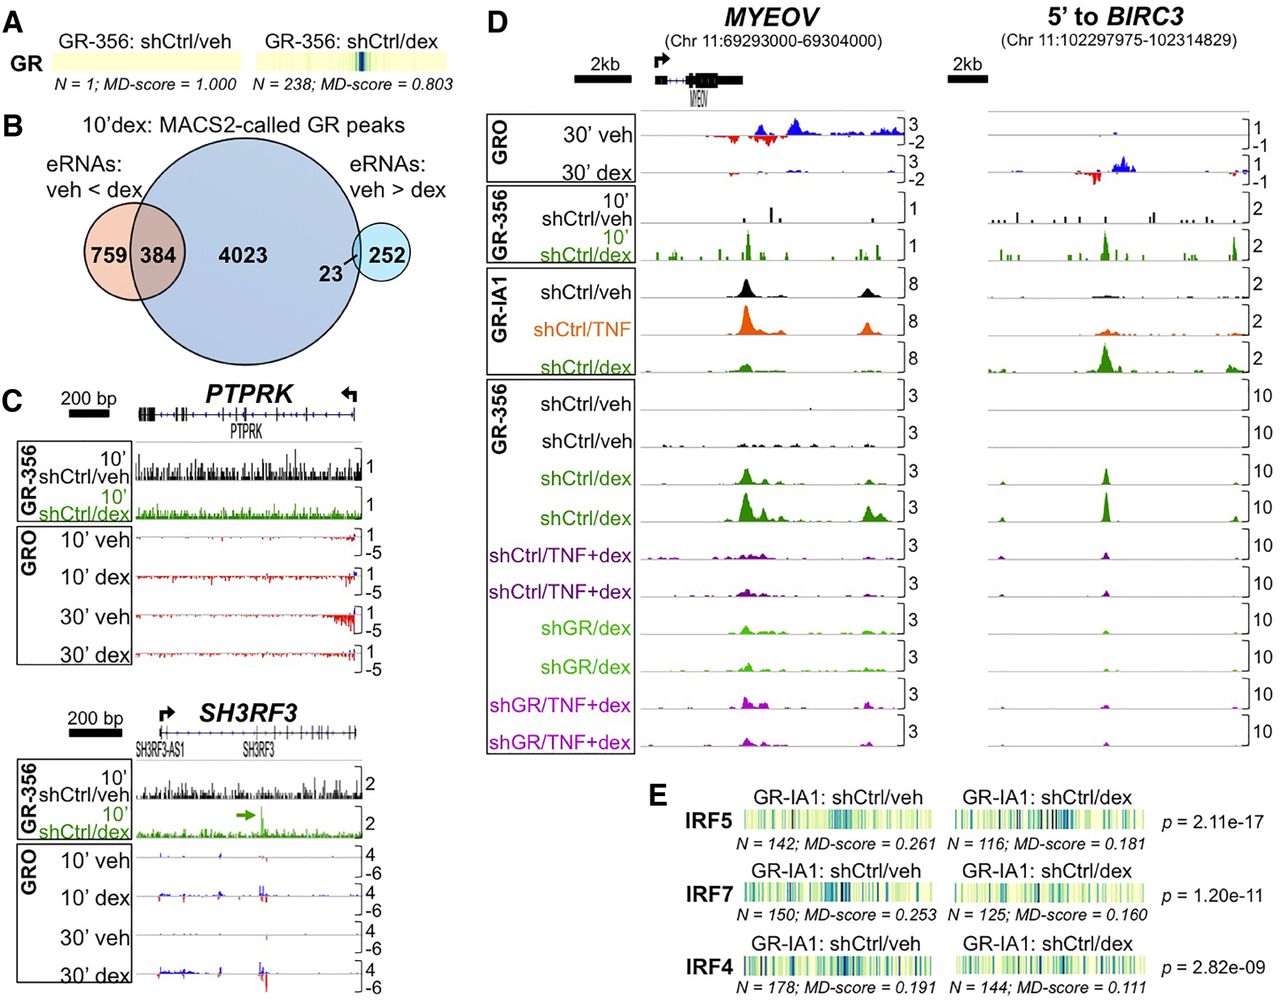
Integrated analysis of 10-min and 1-h GR ChIP-seq data with enhancer activity defined by GRO-seq. (A) Motif displacement analysis of 10-min GR ChIP-seq data reveals robust central enrichment of the GR binding motif. (B) Venn diagram indicating ∼50% overlap between 10-min dex-induced GR binding peaks and dex-induced enhancers versus <10% overlap with repressed enhancers. (C) Example of a dex-repressed enhancer (PTPRK) with no 10-min GR peaks and a dex-induced enhancer (SH3RF3) with a dex-induced peak after 10 min. (D) Integrated ChIP- and GRO-seq analysis reveals qualitatively different occupancy patterns between GR-repressed (MYEOV) and GR-induced (5′ to BIRC3) enhancers. (E) Motif displacement analysis applied to GR-IA1 vehicle versus dex ChIP-seq data.


