
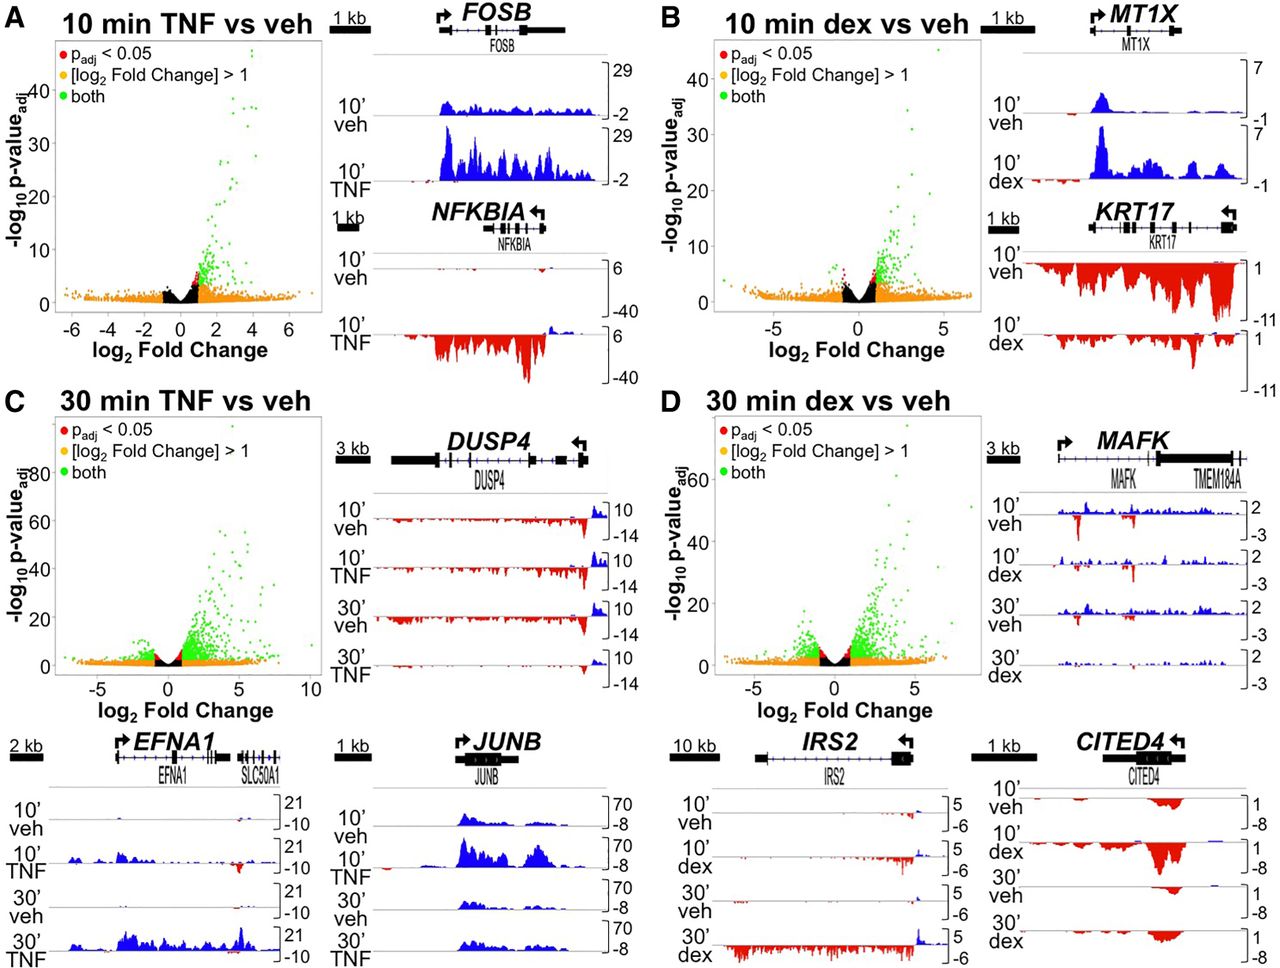
Primary transcriptional effects of TNF and glucocorticoids determined by GRO-seq. (A–D, left/top) Volcano plots indicating differentially regulated nascent transcripts in BEAS-2B cells treated with (A) 10 min TNF versus vehicle (veh), (B) 10 min dex versus veh, (C) 30 min TNF versus veh, and (D) 30 min dex versus veh. Representative examples are shown to the right/bottom of each volcano plot as GRO-seq tracks visualized in the Integrative Genomics Viewer (IGV) browser based on counts per million mapped reads (vertical scales). Positive (blue) peaks are reads annotated to the positive/sense strand while negative (red) peaks reflect reads annotated to the negative/antisense strand. The TSS and direction of transcription are indicated by arrows at the top of each screenshot.


