
Figure 4.
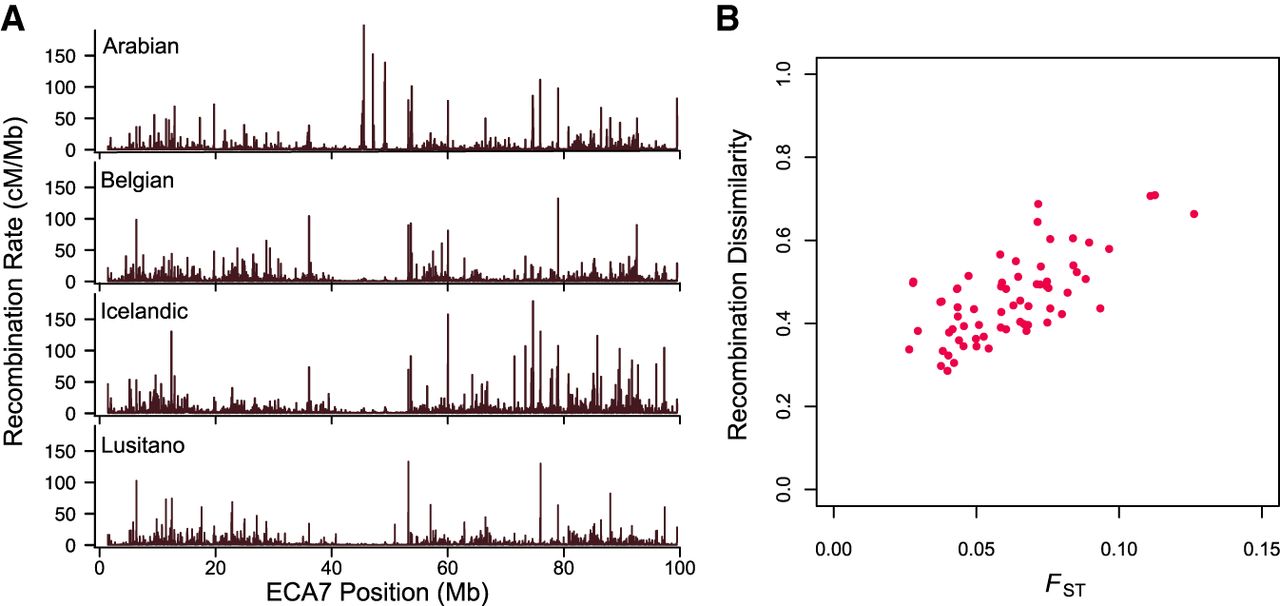
Fine-scale recombination rate variation on ECA7. (A) Recombination rate variation along ECA7 in five breeds. (B) Pairwise FST versus recombination dissimilarity (1 − Spearman's rank correlation coefficient) across ECA7.
(Downloading may take up to 30 seconds. If the slide opens in your browser, select File -> Save As to save it.)
Click on image to view larger version.
Fine-scale recombination rate variation on ECA7. (A) Recombination rate variation along ECA7 in five breeds. (B) Pairwise FST versus recombination dissimilarity (1 − Spearman's rank correlation coefficient) across ECA7.
 CiteULike
 Delicious
 Digg
Digg Facebook
 Google+
 Reddit
 Twitter
