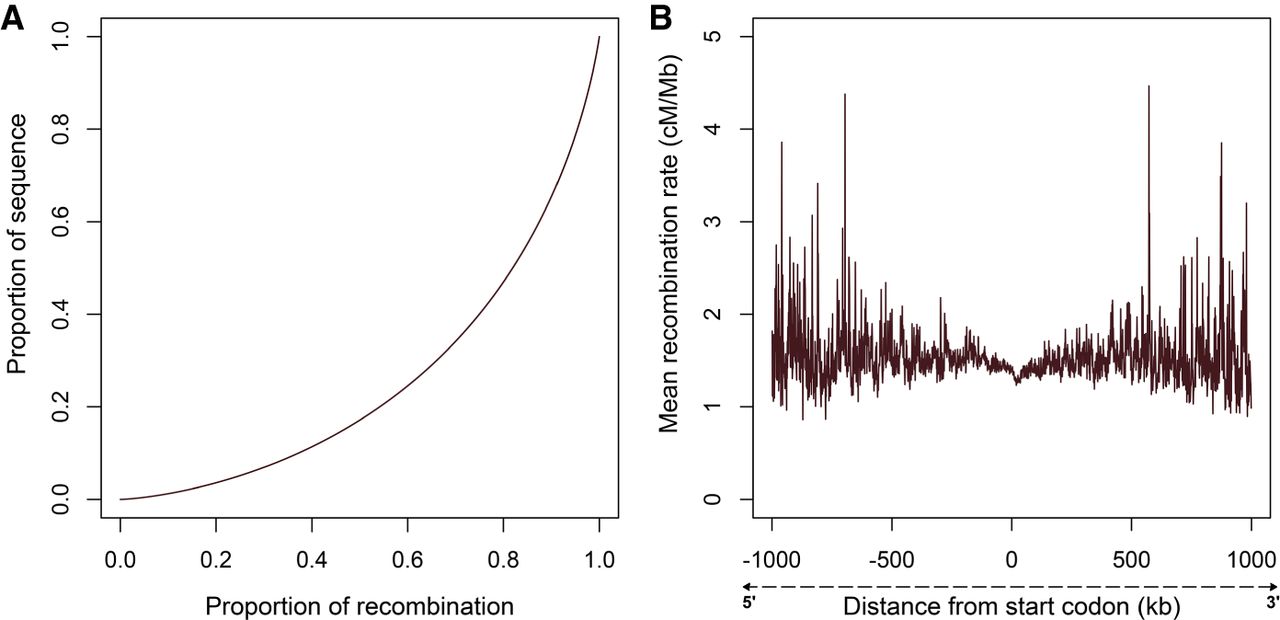
Exploration of fine-scale recombination rate variation in the domestic horse

(Downloading may take up to 30 seconds. If the slide opens in your browser, select File -> Save As to save it.)

Click on image to view larger version.

Figure 1.
Figure 1.

Recombination rate distribution. (A) Proportion of total recombination versus proportion of sequence covered, sorted by highest inter-recombination rate estimates. (B) Recombination rate as a function of distance from the nearest start codon in 1-kb bins.

This Article

  1. Genome Res. 29: 1744-1752

Preprint Server