
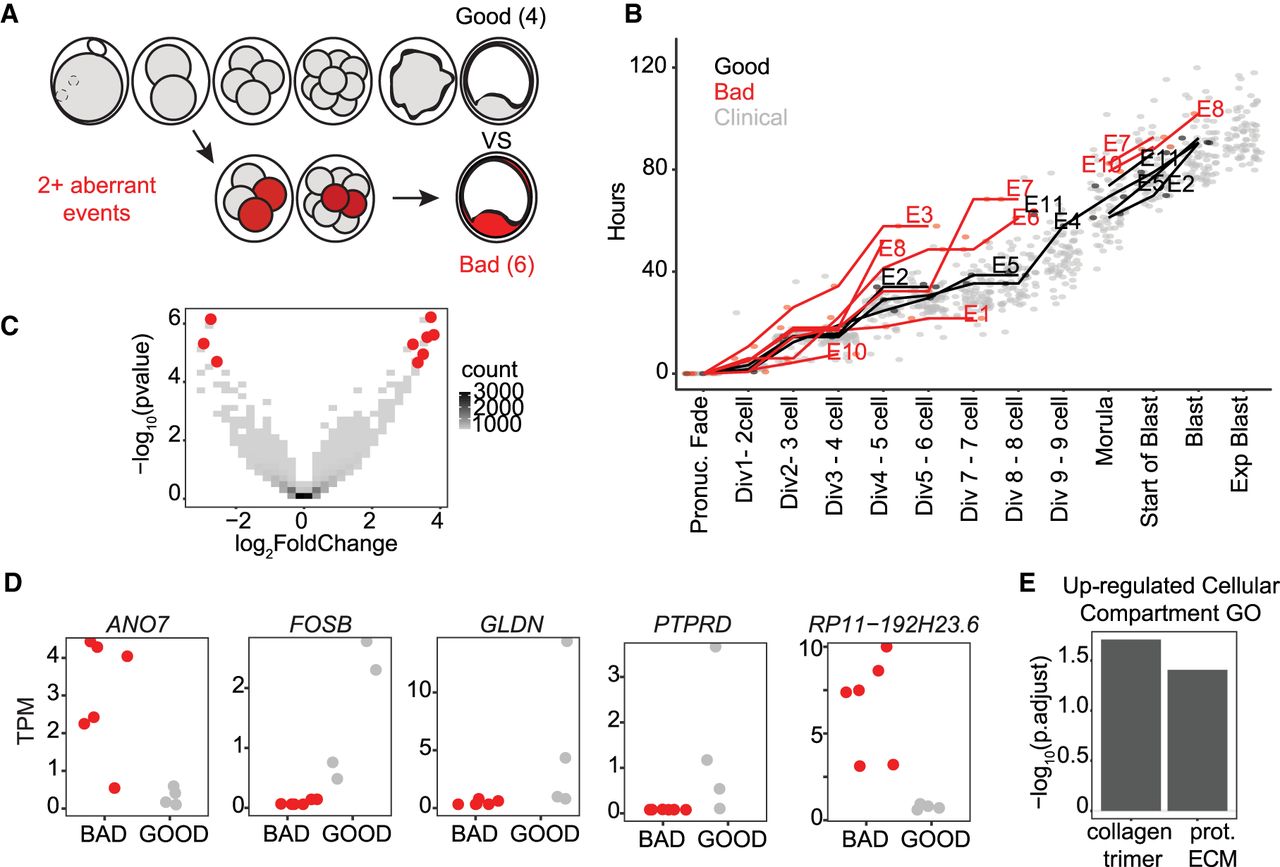
Morphokinetic quality-associated gene sets. (A) Schematic indicating the morphokinetic differential analysis (six low-quality vs. four high-quality embryos). Low quality is defined as deviance by >1 SD from clinical standard in two or more measurements. (B) Comparison of morphokinetic data from embryos in this analysis (red indicates low-quality embryos; black, high quality) to clinical-standard embryos (gray): y-axis is time in hours; x-axis, sequential series of divisions and other embryological events measured from the time of pronuclei fade. (C) Volcano plot of differentially expressed genes from morphokinetic-based differential expression analysis. Red indicates significant differential expression (BH-adjusted P-value <0.05). (D) Jitter plots of selected significant differentially expressed genes from the morphokinetic-based differential expression analysis (adjusted P-value <0.05). (E) Cellular compartment GO analysis from genes up-regulated in embryos that meet clinical standards for morphokinetics.


