
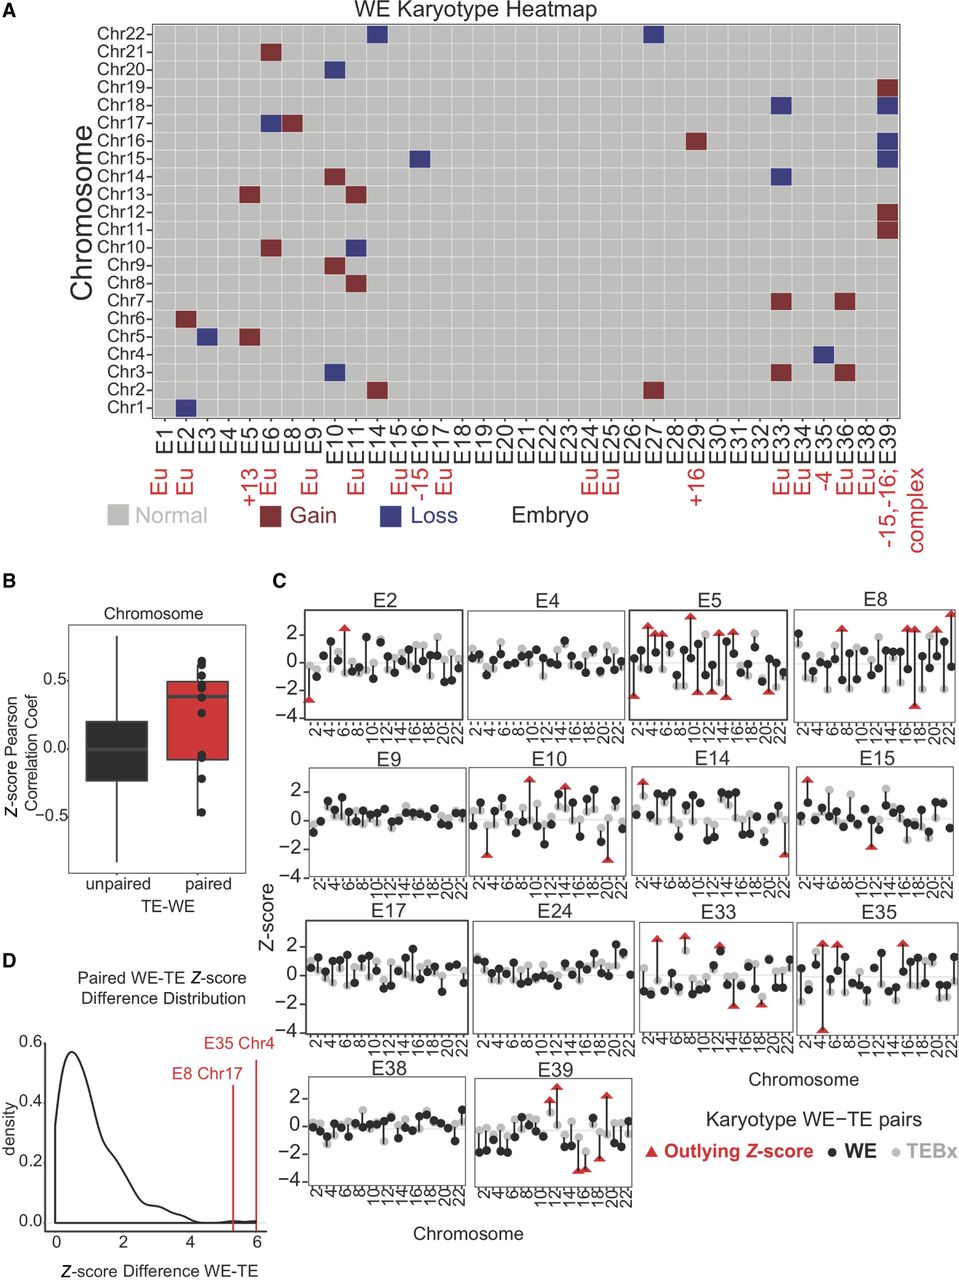
RNA-based digital karyotype. (A) Overview of WE digital karyotypes. Embryos are on the x-axis and chromosomes are on the y-axis. Gray indicates Z-score within the normal range (±2); red, a gain (>2 Z-score); and blue, a chromosomal loss (<−2 Z-score). Red text indicates results of DNA-based PGT-A where applicable. (B) Boxplot of Pearson correlation coefficients comparing Z-score profiles from unpaired (black; from different embryos) or paired (red; from the same embryo) WE and TE samples. (C) Z-score profiles for paired WE and TE biopsy samples. Black dot indicates Z-score (y-axis) of WE; gray dot, Z-score of TE biopsy. Red triangles indicate outlying Z-scores. Chromosomes indicated along the x-axis. (D) Distribution of Z-score differences between WE and TE biopsy for paired samples (originating from the same embryo). Red lines indicate E8 Chromosome 17 and E35 Chromosome 4 as outliers.


