
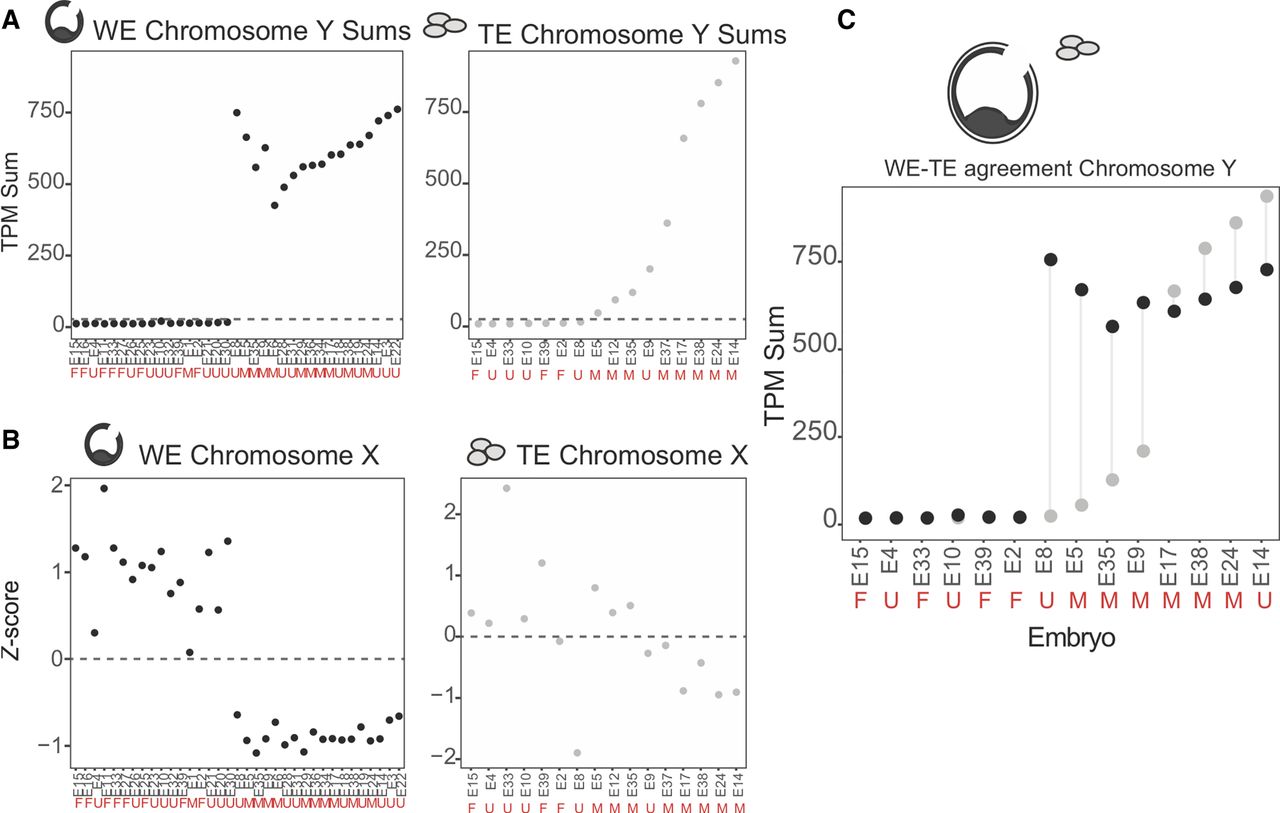
Figure 2.
RNA-based embryo sex chromosome content. (A) Chromosome Y–specific gene TPM sums for all WEs (black; left) and TE biopsy samples (gray; right), respectively. Embryos are on the x-axis and are ordered by Chromosome Y TPM sum. Dashed line indicates sum of 25 TPM threshold for evidence of a Y Chromosome in the sample. Red letters indicate sex chromosome status as determined by DNA-based PGT-A: M = XY; F = XX; U = Undefined. (B) Chromosome X Z-score profiles for all WE and TE biopsy samples, respectively. (C) Chromosome Y TPM sums for paired WE–TE samples (from the same embryo). Red letters indicate PGT-A results. Black dot indicates WE sample; gray dot, TE sample.


