
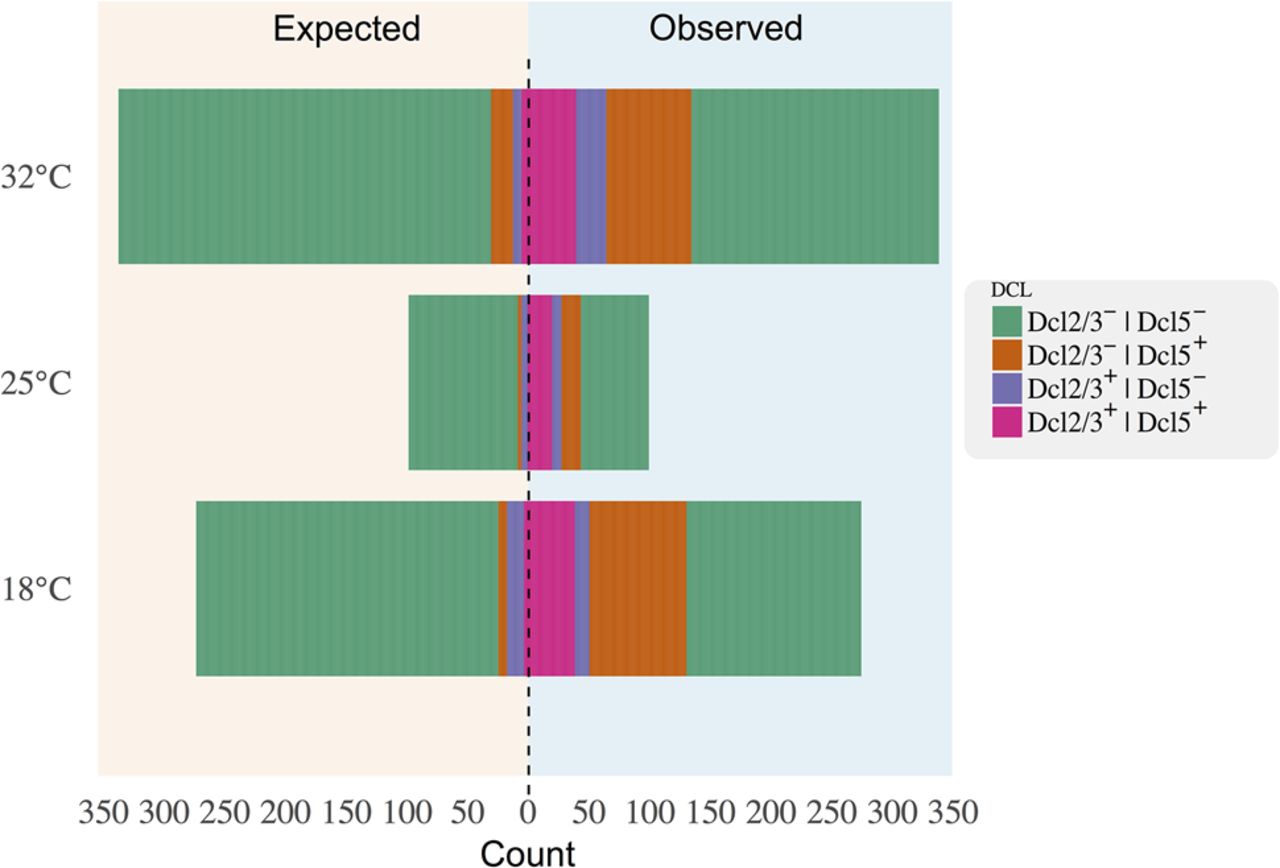
Figure 4.
A large excess of somatic IESs is epigenetically regulated. Back-to-back stacked bar chart showing the number of intra-exonic somatic IESs for all investigated temperatures. For each temperature, IES counts are broken down into Dcl2/3-controlled IESs (Dcl2/3+ | Dcl5−, purple), Dcl5-controlled IESs (Dcl2/3− | Dcl5+, orange), Dcl2/3-Dcl5-co-controlled IESs (Dcl2/3+ | Dcl5+, fuchsia), and Dcl-independent IESs (Dcl2/3− | Dcl5−, green). Expected proportion of Dcl-dependent IESs for random samples of the same size (left) are shown back to back with the observed data (right). Two-proportions Z-test returns P < 0.01 for all expected/observed contrasts.


