
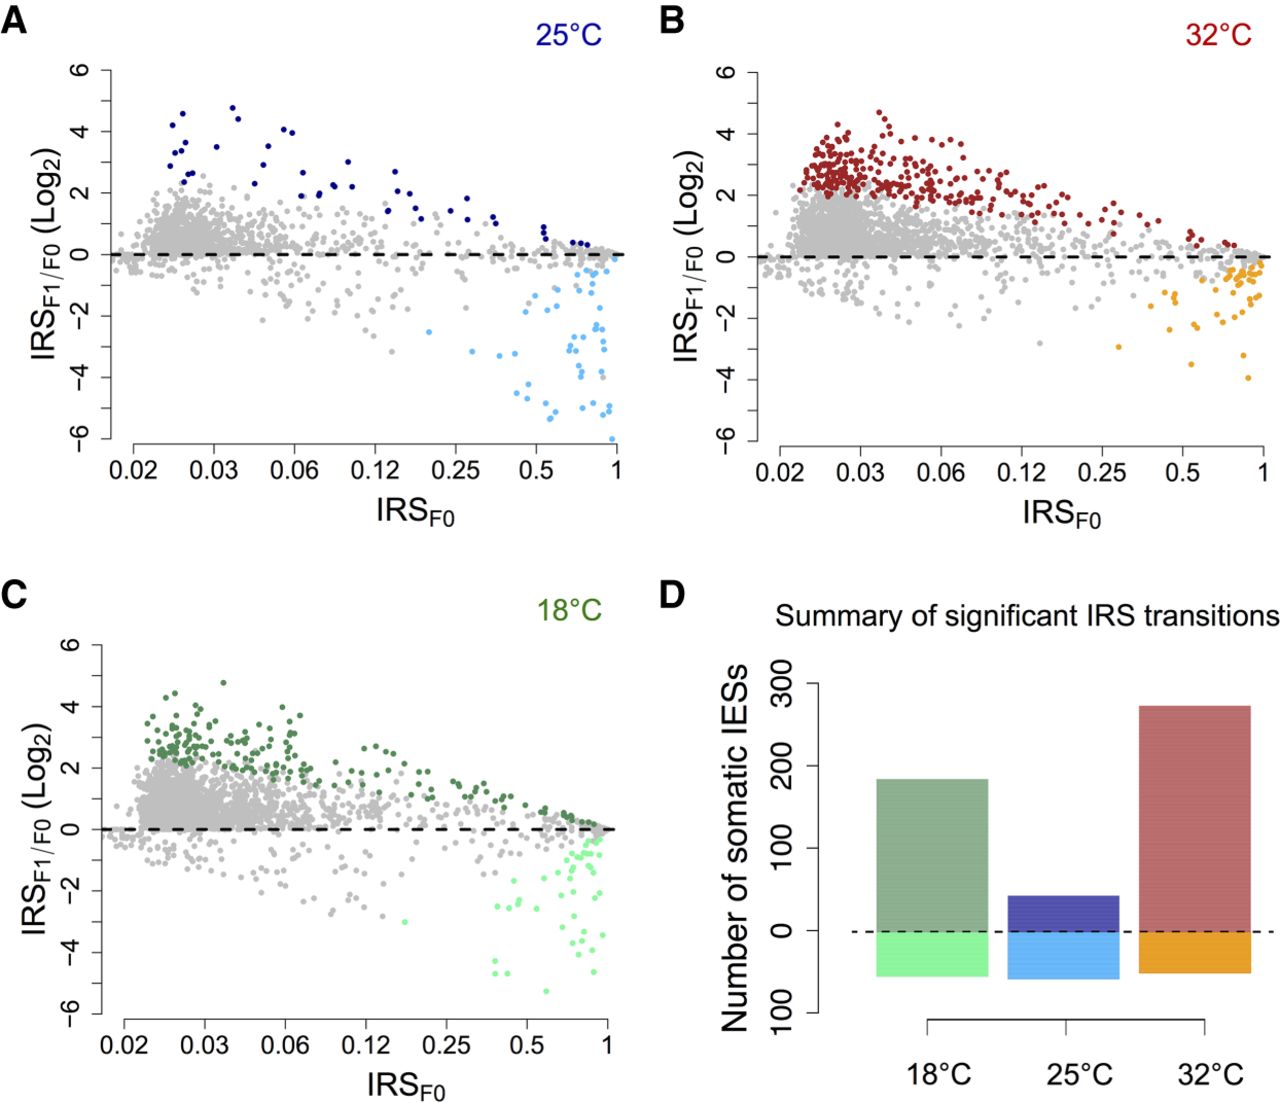
PDE inefficiency shows a U-shaped relationship with temperature. (A–C) Bland-Altman plots displaying the Log2 fold change of IRSs from F0 to F1 for 25°C, 32°C, and 18°C. Statistically significant IRS transitions (binomial test, Padj < 0.05) are shown as filled colored circles: 25°C (dark and light blue circles); 32°C (red and orange circles); 18°C (dark and light green circles) (dark color: IRSF1 > IRSF0; light color: IRSF1 < IRSF0). Position on the x-axis reflects the log-transformed initial (F0) state of the IRSs (x-axis labels are IRSs before log transformation). (D) Counts of statistically significant IRS transitions (Padj < 0.05) after nuclear differentiation at 18°C (green), 25°C (blue), and 32°C (red). The number of somatic IESs experiencing an upward or downward IRS transition is shown above and below the horizontal dashed line, respectively.


