
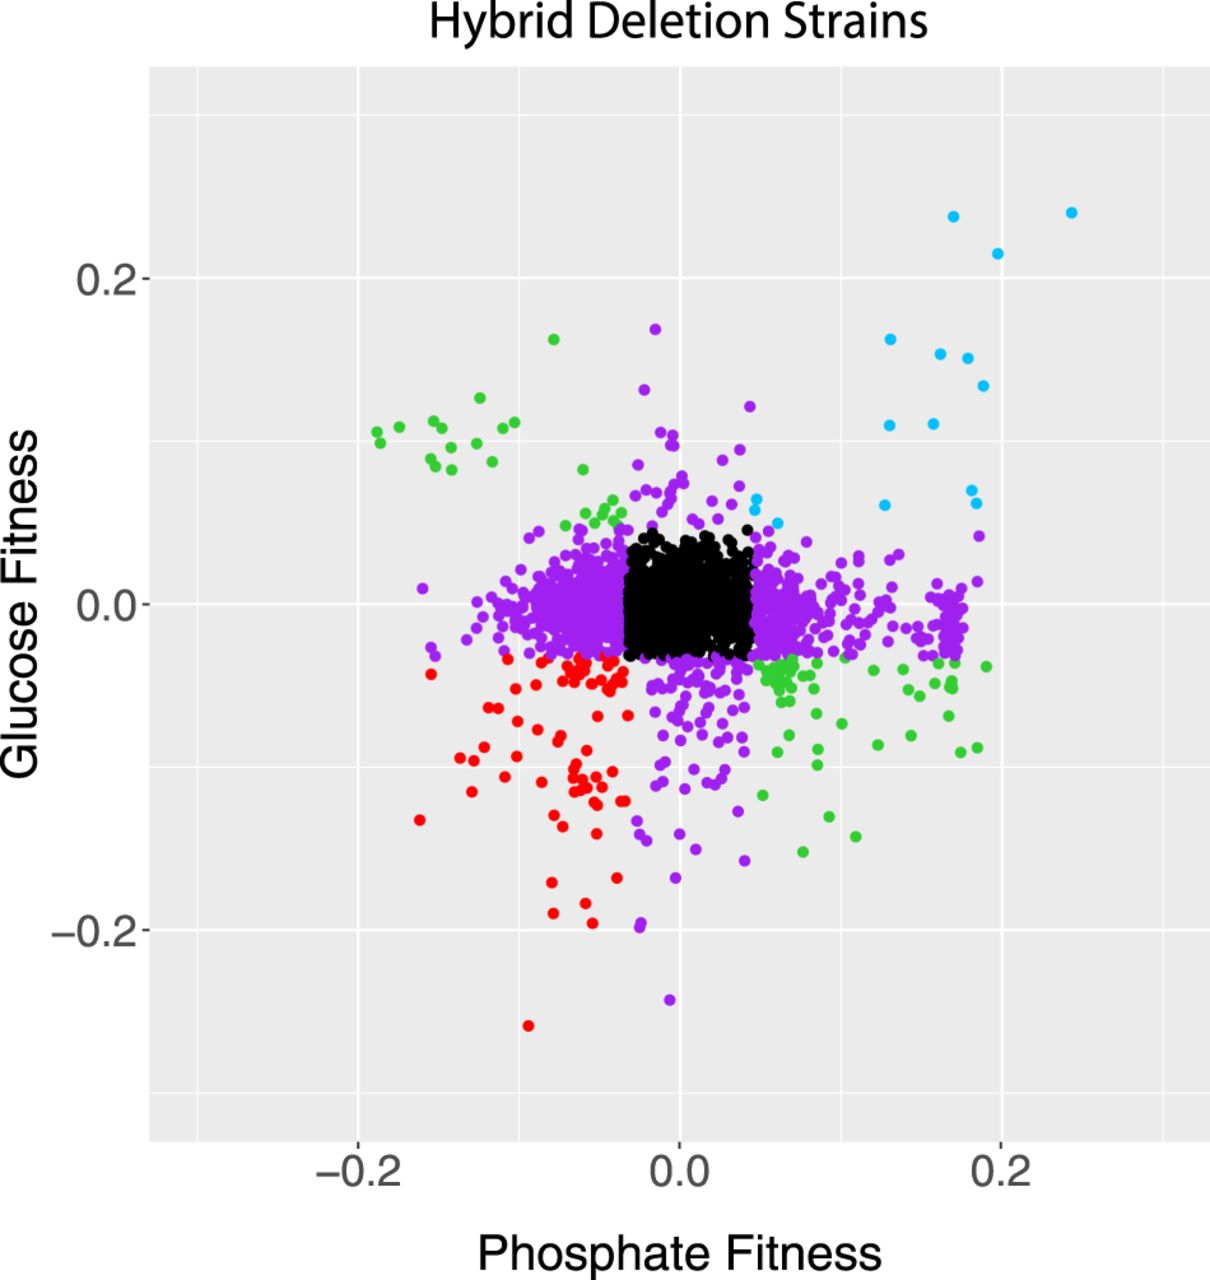
Figure 2.
Fitness values of hybrids compared in glucose and phosphate limitation. Strains in black fall inside the 1% cutoff in both axes, purple strains fall outside the 1% cutoff in just one axis, and the other colors fall outside of the cutoffs in both axes. Comparisons between other media are shown in Supplemental Figure S5. Data from Supplemental Table S1. R2 = 0.00.


