
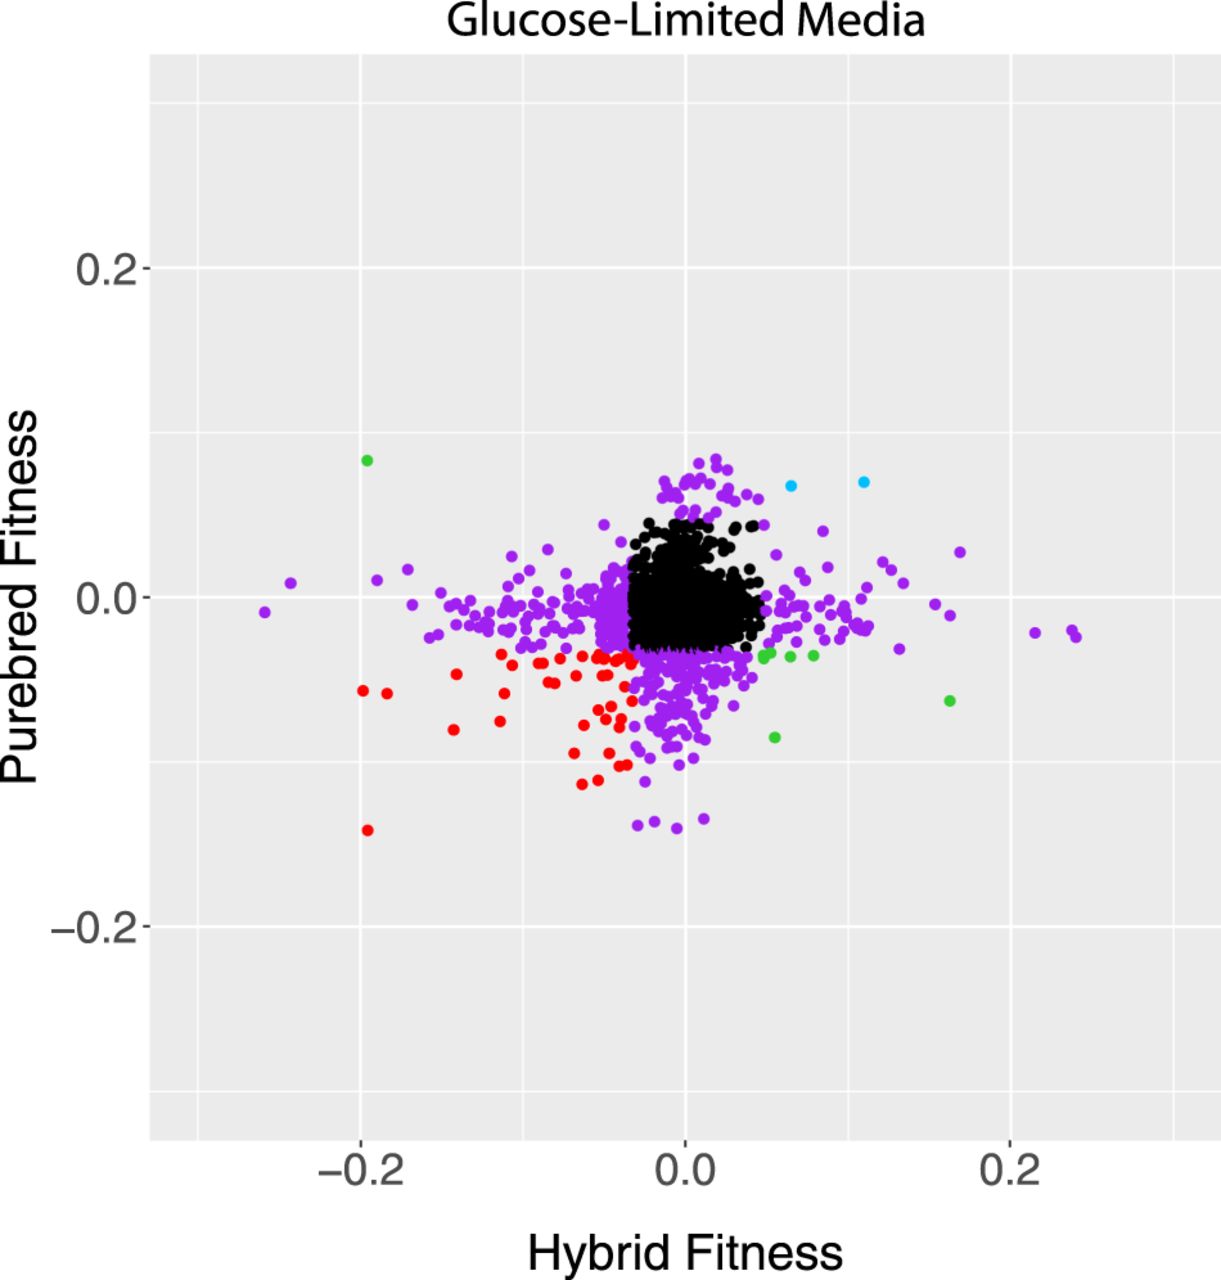
Figure 1.
Scatter plot of fitness values for hybrid and diploid S. cerevisiae strains hemizygous for deletion mutations, measured in glucose limitation (comparisons in other nutrient limitations can be found in Supplemental Fig. S4). Black strains fall inside the 1% cutoff in both axes, purple strains fall outside the 1% cutoff in just one axis, and the other colors fall outside of the cutoffs in both axes. Data from Supplemental Table S1. R2 = 0.00.


