
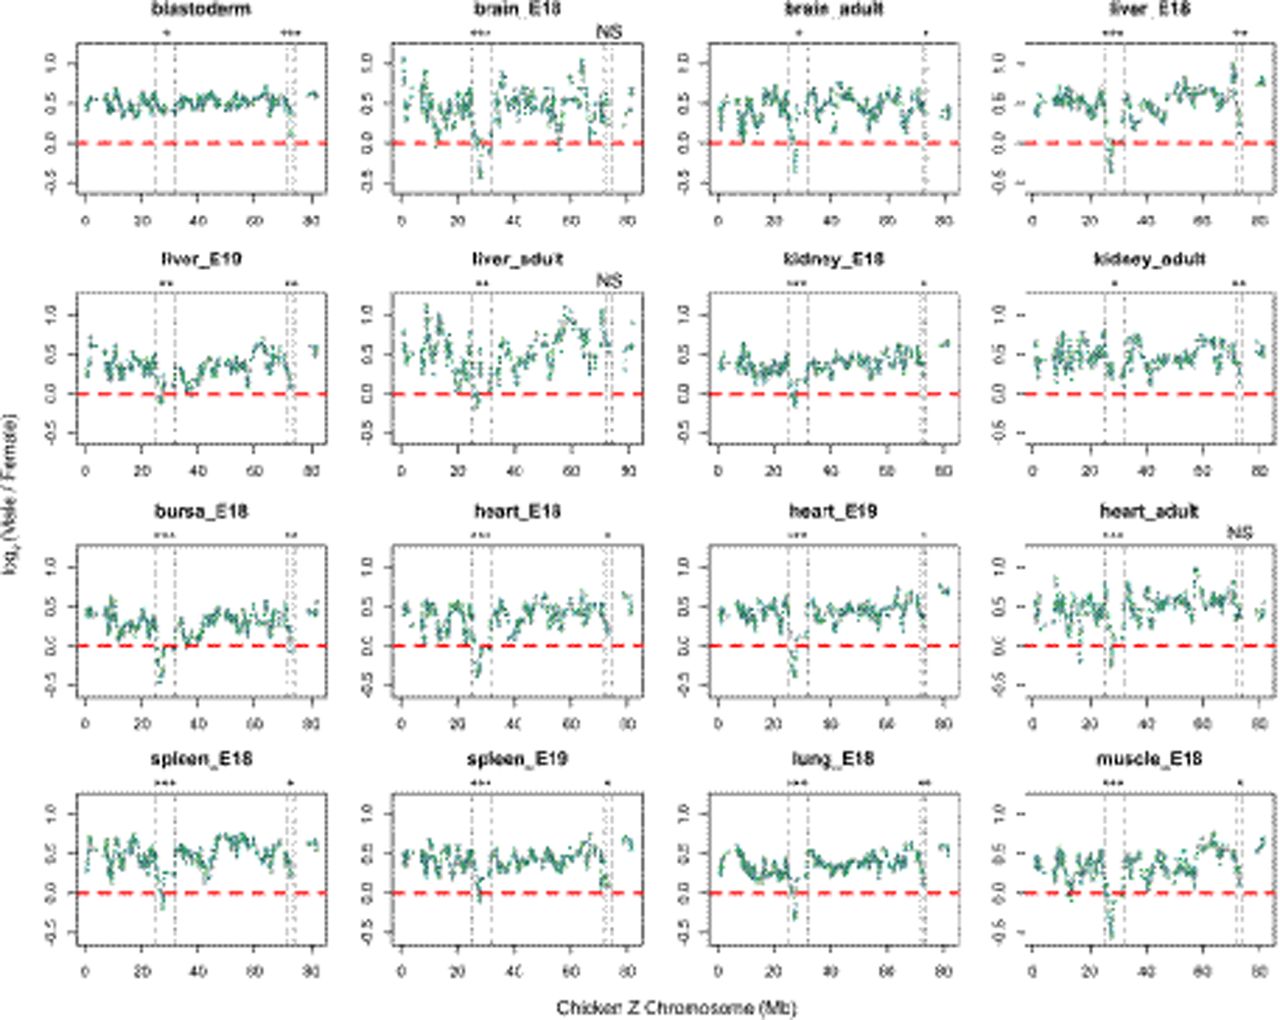
Figure 4.
Sex differences in gene expression across the Z Chromosome. The log2 (Male/Female) values are plotted using a 10-gene window. Genes with average log2(TPM) lower than 1 in either males or females were filtered out. The dashed lines depict the borders of potential MHM1- or MHM2-affected protein-coding genes identified by a changepoint analysis (Methods). For MHM1, the border is 25–32 Mb; and for MHM2, the border is 72.5–73.5 Mb. One-tailed Mann–Whitney U tests were used to test whether the MHM1- or MHM2-neighboring regions consist of genes with lower Male/Female ratios than the Z background. (***) P < 0.001, (**) P < 0.01, (*) P < 0.05, (NS) not significant.


